


FXOpen
Both Ether and Dash ended their uptrends this month. The two cryptocurrencies have been trading sideways during the second half of January but only recently they dipped lower. We haven’t entered a bear market yet but a strong downmove could push us in that scenario.
Ether Ends Uptrend
Ether prices dipped below the 0.01106 swing low last week, thereby ending the relatively brief uptrend. We are back in ‘no mans land’ here. Ether is quoted at 0.01069 at the moment. This is a percentage difference of just under 7% compared to two weeks ago. On the chart below the last 14 days are marked with a yellow rectangle to make it easier to stand out.
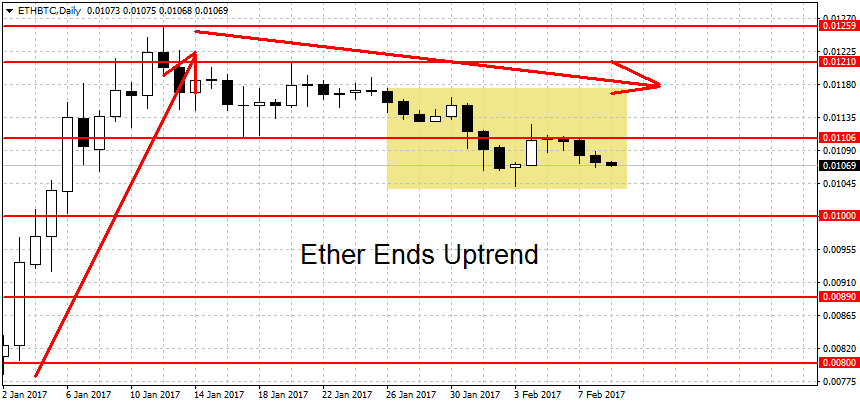
A breakout above the 0.0121 swing high could restart the rally. We have resistance above here at this year’s high of 0.01259. Higher up there’s more resistance at 0.01332 BTC, closely followed by the 0.01382 swing high and the 0.015 round figure.
On the other end, a move below the 0.01 round figure could start a bearish trend. Support can be found at 0.0089 BTC followed by 0.00784. Lower still we have the December low at 0.0073 as potential support, followed by the semi-round figure at 0.05 BTC.
Dash Goes Sideways
Dash ended its uptrend as well and is now trading sideways. We are currently quoted at 0.01619, just below 0.25 percent difference compared to the price noted two weeks ago. This is a negligible amount for a cryptocurrency and demonstrates just how range-bound this pair traded lately.
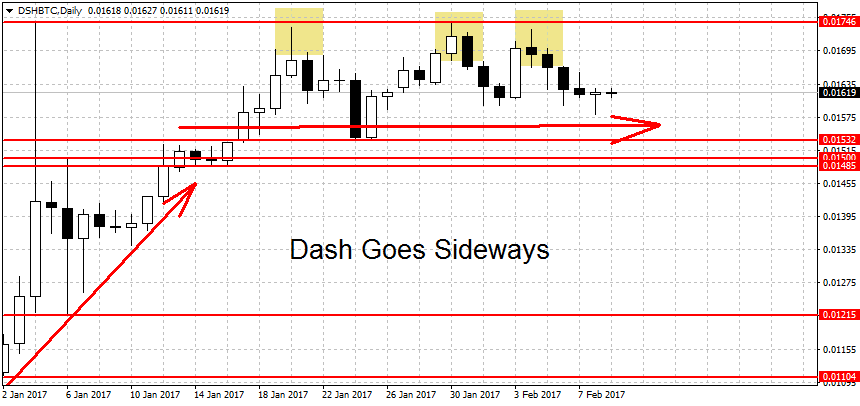
To resume the rally, Dash will have to break above this year’s high at 0.01746. This resistance area is now a quadruple top, after the latest failed breakout on January 30th. Prices traded as high as 0.01746 on that day, narrowly going over the January highs at 0.01744. However we didn’t get a decisive breakout above the previous highs and soon DSH/BTC reversed course, as can be seen on the chart above.
On the lower end, a move below the 0.01532 swing low could start a new downtrend. Support below here can be found at the 0.015 round figure, closely followed by the 0.01485 swing low. The next several support levels are at 0.01215 and 0.01104, followed by the last year’s low for DSH/BTC at 0.01003. A clearing of this strong support area (coupled with a break below the 0.01 round figure) could intensify the losses.
FXOpen offers the world's most popular cryptocurrency CFDs*, including Bitcoin and Ethereum. Floating spreads, 1:2 leverage — at your service. Open your trading account now or learn more about crypto CFD trading with FXOpen.
*At FXOpen UK and FXOpen AU, Cryptocurrency CFDs are only available for trading by those clients categorised as Professional clients under FCA Rules and Professional clients under ASIC Rules respectively. They are not available for trading by Retail clients.
This article represents the opinion of the Companies operating under the FXOpen brand only. It is not to be construed as an offer, solicitation, or recommendation with respect to products and services provided by the Companies operating under the FXOpen brand, nor is it to be considered financial advice.
Latest articles

Anchored VWAP and How You Can Use It in Forex Trading
In the world of forex trading, understanding the nuanced tools at your disposal can significantly enhance decision-making processes. One such sophisticated tool is the Anchored Volume-Weighted Average Price (Anchored VWAP), which refines the standard VWAP by allowing traders to set

META Share Price Collapses after Publication of Quarterly Report
Just yesterday, META's stock price closed at USD 493.50, up approximately 40% since the start of 2024 and up nearly 300% since the start of 2023.
However, following the release of Meta's quarterly report, its shares plummeted to USD

USD/JPY Analysis: The Rate Exceeds The Level of 155 Yen Per US Dollar
Today, the price of USD/JPY once again renewed its 34-year high, exceeding the level of 155 yen per dollar, which put pressure on the current authorities.
According to Reuters, officials are trying to maintain calm in the market.
"We