


FXOpen
Dash is bucking the general downtrend in altcoin prices. While ETH made new yearly lows, Dash is now in rally mode vs BTC.
Ether Hits New 2018 Lows
On Wednesday ETH/BTC hit a new 2018 low at 0.02620 BTC. The represents a loss of 48% from the 0.05052 BTC price recorded only one month ago. In USD terms ETH hit a low of $167 dollars on September 12th before bouncing. We are currently quoted at 0.03138 BTC, around 20 percent off the lows.
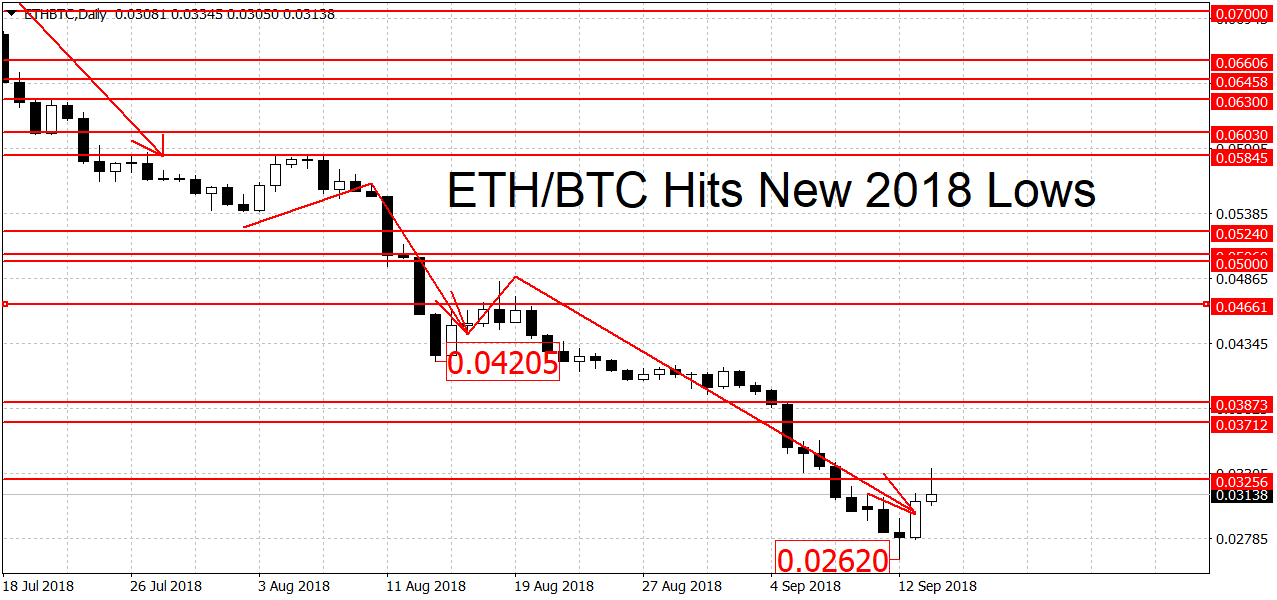
While the downtrend is still in play on the daily charts, we already had some severe losses. Add to that the fact that the trend is now over 2 months old, it’s probably too late to jump in at this stage. Shorts should pay attention to the area around 0.03873 BTC. A breakout above here could finally end the bear. A new rally however requires a breakout above the 0.04171 BTC swing high. More resistance higher up can be found at the 0.04843 BTC swing high and the 0.05 round figure.
On the lower end there’s weak support at the most recent swing low of 0.02620 BTC, followed by the December 2017 lows at 0.02287 BTC. The 0.02 round figure could also act as temporary support. On the longer-term charts ETH/BTC is bearish on the weekly and range-bound on the monthly charts.
Dash Bucks Altcoin Downtrend
Dash prices are bucking the general downtrend for altcoin prices. The DSH/BTC pair is now in a slight uptrend vs BTC, at least on the daily charts. The low here was hit on August 26th with 0.02079 BTC. We are trading at 0.02822 BTC right now, almost 36 percent higher.
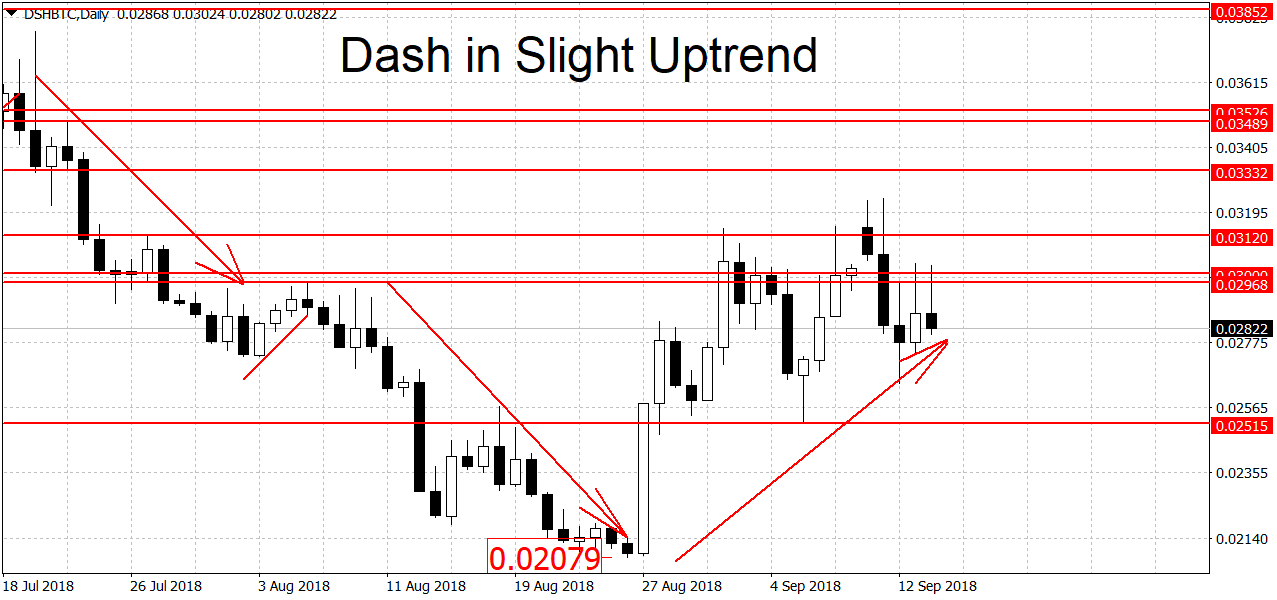
Part of the reason why DSH/BTC is performing so well recently could be the fact that it experienced a sharper drop then ETH earlier in the year. For example, the coin is now below it’s December 2017 lows at 0.03452 BTC.
The bulls should pay attention to the area around the recent swing low at 0.02515 BTC. A decisive breakdown below the 0.025 round figure could end the tentative uptrend. A move below 0.02079 BTC is needed for a new downtrend.
Higher up we have some resistance at 0.03234 BTC followed by a stronger level at the previous swing low at 0.03452 BTC and the 0.035 BTC round figure. On the longer-term charts the picture is mixed. The trend on the weekly charts is bearish while the monthlies are in neutral territory.
Trade altcoins on FXOpen Crypto accounts.
FXOpen offers the world's most popular cryptocurrency CFDs*, including Bitcoin and Ethereum. Floating spreads, 1:2 leverage — at your service. Open your trading account now or learn more about crypto CFD trading with FXOpen.
*At FXOpen UK and FXOpen AU, Cryptocurrency CFDs are only available for trading by those clients categorised as Professional clients under FCA Rules and Professional clients under ASIC Rules respectively. They are not available for trading by Retail clients.
This article represents the opinion of the Companies operating under the FXOpen brand only. It is not to be construed as an offer, solicitation, or recommendation with respect to products and services provided by the Companies operating under the FXOpen brand, nor is it to be considered financial advice.
Latest articles

Anchored VWAP and How You Can Use It in Forex Trading
In the world of forex trading, understanding the nuanced tools at your disposal can significantly enhance decision-making processes. One such sophisticated tool is the Anchored Volume-Weighted Average Price (Anchored VWAP), which refines the standard VWAP by allowing traders to set

META Share Price Collapses after Publication of Quarterly Report
Just yesterday, META's stock price closed at USD 493.50, up approximately 40% since the start of 2024 and up nearly 300% since the start of 2023.
However, following the release of Meta's quarterly report, its shares plummeted to USD

USD/JPY Analysis: The Rate Exceeds The Level of 155 Yen Per US Dollar
Today, the price of USD/JPY once again renewed its 34-year high, exceeding the level of 155 yen per dollar, which put pressure on the current authorities.
According to Reuters, officials are trying to maintain calm in the market.
"We