


FXOpen
The price of crude oil dipped to the lowest level since 2003 on Monday, dragging the black gold to less than $29 a barrel after the landmark nuclear deal between the world powers and Iran during weekend. The technical bias remains extremely bearish because of a Lower Low in the ongoing downside move.
Technical Analysis
As of this writing, the West Texas Intermediate (WTI) futures are being traded around 28.78. A support may be noted near $25.04, the swing low of 31st March 2003 ahead of $16.70, the low of 2001. A break and daily closing below the $16.70 support area could incite renewed selling pressure towards the $10 zone.
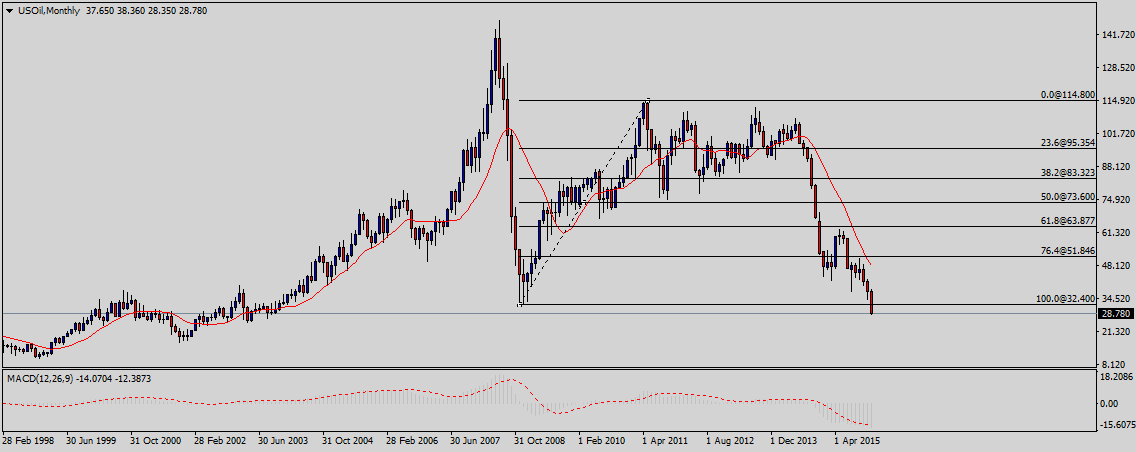
On the upside, the black gold is expected to face a hurdle near $30, the psychological number ahead of $32.40, the horizontal resistance and then $50.90, the swing high of the last major upside rally.
EU Lifts Iran Sanctions
The European Union on Saturday lifted its economic sanctions against Iran after the UN atomic watchdog announced that Tehran had complied with the terms of last July’s landmark deal aimed at scaling down its nuclear programme. The lifting of the sanctions came into effect late Saturday after the decision was published in the bloc’s Official Journal, less than an hour after the move was formally adopted by all 28 member states.
A total of 92 Iranians and 466 companies or groups, including the Iranian central bank, were affected by the EU sanctions. Some sanctions, not linked to the accord, will remain in place however, including European sanctions linked to human rights and US sanctions linked to terrorism.
Trade Idea
Considering the overall technical and fundamental outlook, buying the black gold around current levels could be a good strategy if we get a valid bullish reversal candle on the daily chart.
Trade over 50 forex markets 24 hours a day with FXOpen. Take advantage of low commissions, deep liquidity, and spreads from 0.0 pips. Open your FXOpen account now or learn more about trading forex with FXOpen.
This article represents the opinion of the Companies operating under the FXOpen brand only. It is not to be construed as an offer, solicitation, or recommendation with respect to products and services provided by the Companies operating under the FXOpen brand, nor is it to be considered financial advice.
Latest from Forex Analysis
Latest articles

Google Share Price Rose Post-market to a New All-time Record
Yesterday, after the close of the main trading session, a report on activities for the 1st quarter of Alphabet Inc. (Google's parent company) was published. The report was strong, exceeding investors' expectations.
→ Quarterly EPS = USD 1.89 (expected = USD 1.

S&P 500 Rebounds after Negative GDP News
Data released yesterday showed US GDP growth slowed to 1.6% in the first quarter of the year. According to ForexFactory: forecast = 2.2%, past value = 2.4%.
Reaction to the news sent the S&P 500 mini stock

GBP/USD And USD/CAD Daily Chart Outlook
GBP/USD is attempting a recovery wave from 1.2300. USD/CAD is consolidating and might aim for a move above the 1.3760 resistance zone.
Important Takeaways for GBP/USD and USD/CAD Analysis Today
· The British Pound started