


BTCUSD and XRPUSD Technical Analysis – 21st DEC, 2021
FXOpen
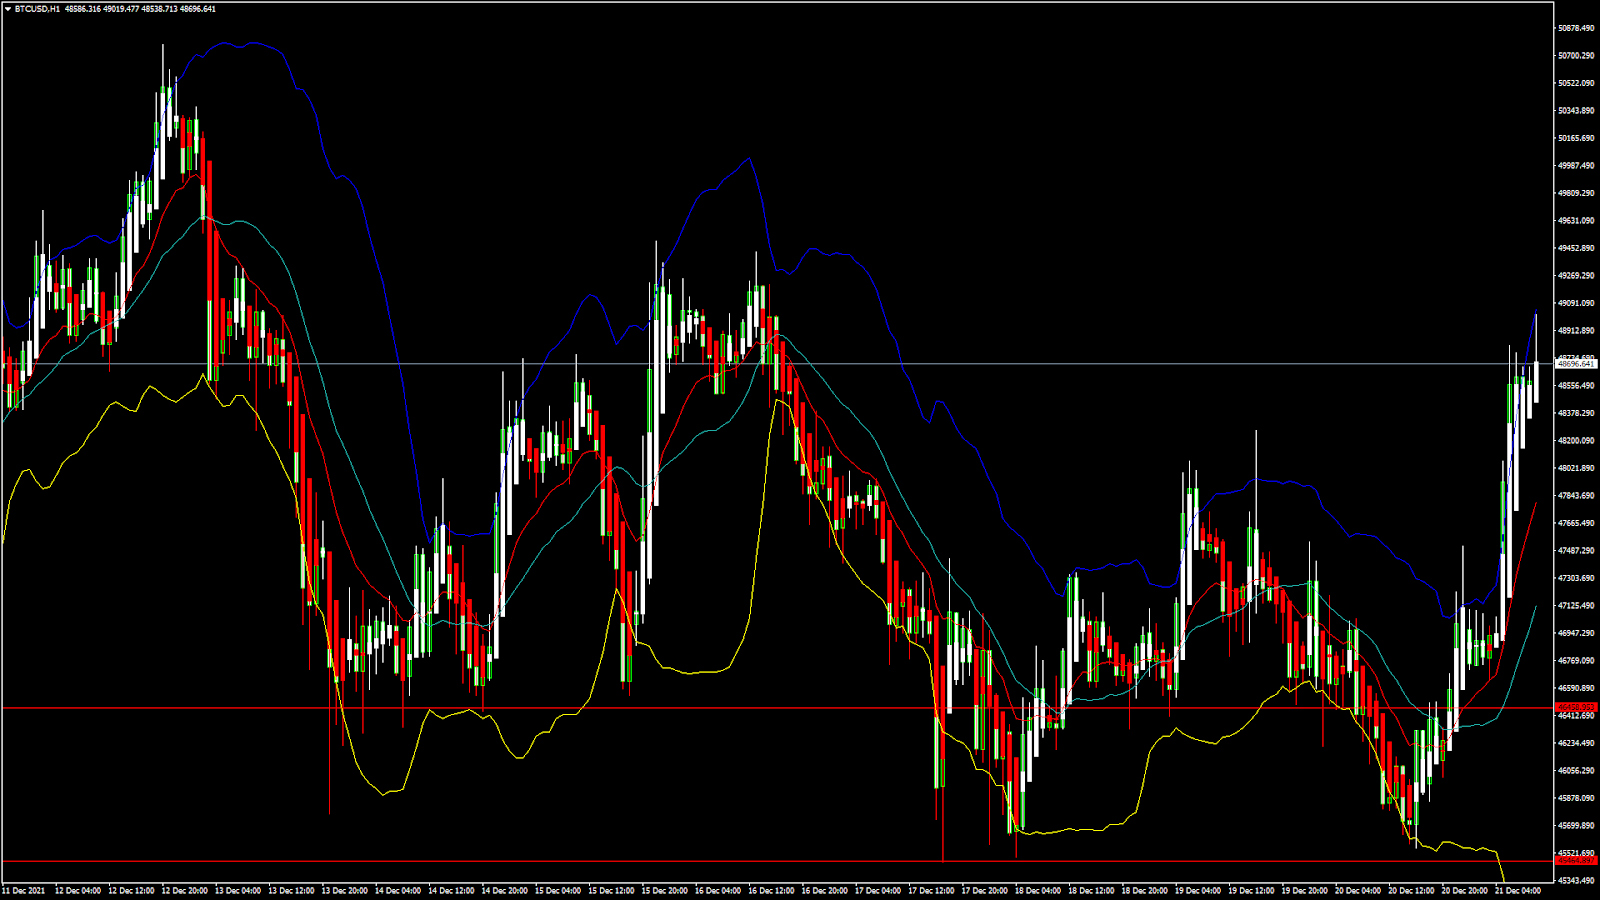
BTCUSD: Double Bottom Pattern Above $45,000
Bitcoin started the week on a bearish tone by breaking the $46,000 handle, and touching a low of $45,578 in yesterday’s US trading session.
After this decline, we saw a renewed buying pressure which continues to push the prices higher in today’s European trading session.
The global fall in cryptocurrencies is happening because of the emergence of the Omicron coronavirus variant, as well as the approaching ending of the year whereby the investments in the financial markets is at its lowest.
Bitcoin has gone back in the bullish channel and been trading above the $48,000 handle; we could see more upsides in the range of $49,000 to $49,500 later today.
Now, we can clearly see a double-bottom bullish reversal pattern above the $45,000 handle signifying the end of a downtrend and a shift towards an uptrend.
At present, the bitcoin price is trading in a consolidation phase above the $48,000 handle, which is expected to continue in the US trading session.
Both the Stoch and StochRSI are indicating an OVERBOUGHT level meaning that in the immediate short-term, a decline is expected.
Bitcoin is now moving above its both 100 hourly simple and exponential moving averages.
The average true range is indicating a lesser market volatility, which means that markets will enter a consolidation phase soon.
- Bitcoin trend reversal is seen above $45,000
- The Williams percent range is Indicating an OVERBOUGHT level
- The price is now trading just above its pivot level of $48,572
- All the moving averages are giving a STRONG BUY signal at the current market level of $48,676
Bitcoin’s Bullish Reversal Above $45,000 Confirmed
We can now see that the bullish trend for bitcoin remains intact, and the prices are expected to cross the important psychological resistance level of $50,000 very soon.
All of the major technical indicators are giving a STRONG BUY signal, which means that we can expect a fresh rally coming into the markets any time.
The price of BTCUSD is now facing its classic resistance level of $48,691 and Fibonacci resistance level of $48,808, after which the path towards $50,000 will get cleared.
In the last 24hrs, BTCUSD has gone UP by 5.17% with a price change of $2,393, and has a 24hr trading volume of USD 31.610 billion. We can see an Increase of 11.33% in the trading volume as compared to yesterday. This increase happened thanks to the increased buying pressure after the confirmation of the bullish channel.
The Week Ahead
We can see that bitcoin has started its long overdue upside correction, and the price has reached the consolidation level above the $48,000 mark.
The medium to long-term outlook remains BULLISH for bitcoin with targets of $52,000 to $55,000.
The relative strength index is above 70, indicating a stronger demand for buying BTCUSD in the markets.
At present, long-term buyers can enter into markets with a time frame of 6 months to 1 year.
90% of Bitcoins Mined
Over the course of 12 years, 90% of all bitcoins have been mined, explaining the increase in global circulation levels and market liquidity of available coins.
According to the Bitcoin founder Satoshi Nakamoto, the total supply is 21 million; the mining of the remaining 10%, however, will take 120 years due to the halving process.
Crypto in 2021
In 2021, we saw massive inflows in crypto and bitcoin, something that led to the increase in total market capitalization and massive gains for long-term investors who had invested in the beginning of the year.
In total, we saw capital inflow of more than USD 30 billion — this is why 2021 has been nicknamed the Year of Crypto. In comparison, the capital inflow in 2018 was at USD 8 billion, the second best year for crypto investors globally.
Technical Indicators:
Relative strength index (14-day): at 73.68 indicating a BUY
Average directional change (14-day): at 47.40 indicating a BUY
Rate of price change: at 5.542 indicating a BUY
Moving averages convergence divergence (12,26): at 496.50 indicating a BUY
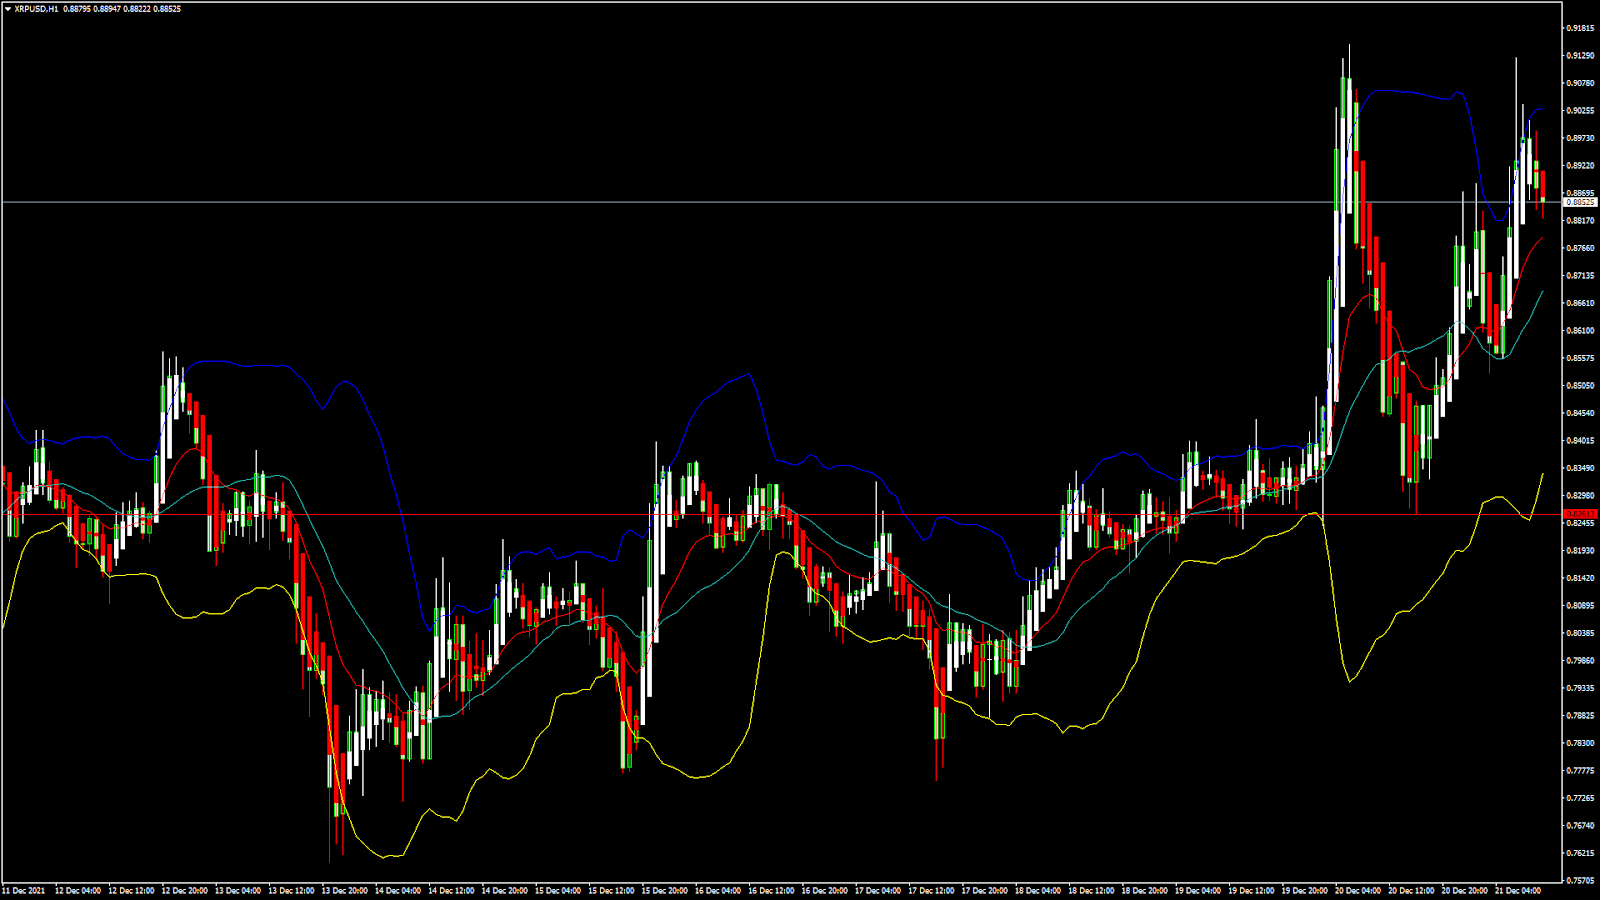
XRPUSD: Cup and Handle Pattern Above 0.8200
Ripple started this week on a bullish momentum as it touched a high of 0.9149, after which the price declined due to the heavy selling pressure that was seen in the crypto markets globally.
In today’s US trading session, we can see that the XRPUSD is trading above the 0.8800 level after recovering from its yesterday’s low of 0.8261.
We can clearly see a cup-and-handle pattern above 0.8200 level which is a continuing bullish pattern, indicating the overall bullish trend.
The price of ripple is now moving into a consolidation phase below the 0.8800 handle, and we can see a bullish confirmation.
The short-term outlook for ripple has turned bullish, medium-term outlook appears bullish, and the long-term outlook is strongly bullish.
In the European trading session, Ripple is trading just below its pivot level of 0.8901, remains below its classic resistance level of 0.9032, and Fibonacci resistance level of 0.8982.
- All the technical Indicators are giving a STRONG BUY signal
- Ripple has entered into a bullish channel above 0.8200
- All the moving averages are giving a STRONG BUY signal
- Average true range indicates a HIGH market volatility
Ripple: Bullish Channel Above 0.8200 Confirmed
Ripple is now on its way towards recovery from its initial losses seen last week. The bullish continuation pattern is clear and we are now looking for targets of 1.0000 before the end of 2021. Market volatility is HIGH today thanks to the confirmation of the bullish channel for XRPUSD.
The price of XRPUSD has gone UP by 3.20% with a price change of $0.02749 in the past 24hrs, and has a trading volume of 4.101 billion USD.
We can see a 26.89% Increase in Ripple trading volume in the last 24 hours. This increase occurred due to the renewed buying pressure from investors globally who are looking to invest their profits liquidated from bitcoin and Ethereum. This is also the reason why many crypto analysts expect a big rally in XRPUSD to outperform the leading cryptocurrencies.
This Week Ahead
Ripple price is now in the consolidation level above the 0.8800 handle in the European trading session.
The relative strength index is valued at 58 indicating a strong buying pressure, and a new rally is expected any time this year.
We are now looking at a level of above $1.1000 before the end of 2021.
US SEC Case Against Ripple Labs
In 2020, the US Securities and Exchange Commission filed a case against Ripple Labs for allegedly raising capital of USD 1.3 billion through an unregistered digital asset securities offering.
Ripple also distributed billions of XRP in 2013 for its non-cash transactions, which was a violation of federal and securities laws.
Many investors are now awaiting the outcome of the case in favor of Ripple Labs, which could push the price of XRPUSD above the $1.5000 mark.
Technical Indicators:
Moving averages convergence divergence (12,26): at 0.010 indicating a BUY
Average directional change (14-day): at 48.40 indicating BUY
Relative strength index (14-day): at 58.57 indicating a BUY
Rate of price change: at 3.033 indicating a BUY
FXOpen offers the world's most popular cryptocurrency CFDs*, including Bitcoin and Ethereum. Floating spreads, 1:2 leverage — at your service (additional fees may apply). Open your trading account now or learn more about crypto CFD trading with FXOpen.
*Important: At FXOpen UK, Cryptocurrency trading via CFDs is only available to our Professional clients. They are not available for trading by Retail clients. To find out more information about how this may affect you, please get in touch with our team.
This article represents the opinion of the Companies operating under the FXOpen brand only. It is not to be construed as an offer, solicitation, or recommendation with respect to products and services provided by the Companies operating under the FXOpen brand, nor is it to be considered financial advice.
Stay ahead of the market!
Subscribe now to our mailing list and receive the latest market news and insights delivered directly to your inbox.


Latest articles

NZD/USD Analysis: A Tug-of-War at the Critical Level
The kiwi has strengthened meaningfully against most peers this month. However, against the US dollar specifically, NZD/USD remains well below its 2026 highs, trading in the mid-0.58 area versus January's peak near 0.6075.
New Zealand's Q2 inflation

AUD/USD and USD/CAD React to Rising Geopolitical Risks
Commodity-linked currencies remain under pressure as geopolitical tensions in the Middle East continue to escalate. The United States has maintained strikes on targets in Iran, while the Tehran-backed Houthis have intensified threats to shipping in the Red Sea and near

GBP/CHF: Trendline or RSI — Which One Is Lying?
Sterling enters this week on firmer footing, with political uncertainty fading fast after Andy Burnham's confirmation as Labour leader eased investor concerns over the succession to Keir Starmer. Markets reacted further to reports pointing to Shabana Mahmood as the frontrunner