


BTCUSD and XRPUSD Technical Analysis – 1st MAR 2022
FXOpen

BTCUSD – Double Bottom Pattern Above $34000
Bitcoin has ended its bearish phase after touching a low of 34393 on 24th February and continues to move upwards after the consolidation phase above the 38000 levels.
The Bullish momentum we see today is the result of the increased buying demands from the global markets after the recent sanctions imposed on the Russian banking systems and the use of Bitcoin for converting the Russian Rubles into the desired currencies like the US Dollar and the Euros.
The propagation of the Bullish trend continues with the prices of Bitcoin trading above the $43000 mark in the European Trading session today.
The sharp rise that we see in the levels of Bitcoin is due to the fresh demands coming from the residents of Ukraine who are moving out and liquidating their assets and converting them into Bitcoins for safety.
We can see a Double Bottom Pattern above the $34000 handle which is a Bullish reversal pattern because it signifies the end of a downtrend and a shift towards an Uptrend.
STOCH and Williams Percent Range are indicating OVERBOUGHT levels which means that in the immediate short term a decline in the prices is expected.
The relative Strength Index is at 76 indicating a STRONG demand for Bitcoin at the current market levels.
Bitcoin is now moving above its 100 hourly Simple Moving average and below its 200 hourly Exponential Moving averages.
All of the Major Technical Indicators are giving a STRONG BUY Signal, which means that in the immediate short-term we are expecting targets of 45000 and 48000.
The Average True Range is indicating Less Market Volatility with a Strong Bullish momentum.
· Bitcoin Bullish Reversal is seen Above $34000.
· Williams Percent Range is Indicating OVERBOUGHT Levels.
· The price is now trading just Below its Pivot Levels of $43470.
· All of the Moving Averages are giving a STRONG BUY market signal.
Bitcoin Bullish Momentum Seen Above $34000

Bitcoin continues to move in a Strong Bullish momentum with an upside projection towards levels of 45000 in the European Trading session today.
In the immediate term, we are expecting a continuation of this bullish trend with the prices of Bitcoin ranging between the levels of $41000 and $46000 as it is due to enter into a consolidation phase now.
After crossing the horizontal levels of 42000 the appreciation in the prices of Bitcoin we see will result in a Rally towards the $50000 handle.
The immediate short-term outlook for Bitcoin is Strong Bullish, the Medium-term outlook is Bullish, and the long-term outlook remains Bullish.
The price of BTCUSD is now facing its Classic resistance levels of 43622 and Fibonacci resistance levels of 43740 after which the path towards 48000 will get cleared.
We can see that the daily RSI is also printing at 59 which indicates that in the medium-term prices are expected to appreciate further.
In the last 24hrs, BTCUSD is UP by 13.70% by 5243$ and has a 24hr trading volume of USD 38.490 Billion. We can see an increase of 46.69% in the Trading volume as compared to yesterday, due to increased selling buying pressure in the Global cryptocurrency markets.
The Week Ahead
The prices of Bitcoin are due to enter into a consolidation phase above the $42000 level. We can see some range of bounded movements in its levels between $42000 to $46000.
The prices of Bitcoin are appreciating as an alternative source of cross-border payments after the recent sanctions that are being imposed on Russia by the SWIFT network.
In the immediate short term, Bitcoin Bullish momentum is expected to continue pushing its levels above the $46000 handle this week.
In the event of a pullback, the upside projection is at the 100-day SMA of $44992.
The prices of BTCUSD will need to remain above the important support levels of $40000 this week.
The weekly outlook is projected at $41000 with a consolidation zone of $44000.
Technical Indicators:
Relative Strength Index (14days): It is at 74.64 indicating a BUY.
Average Directional Change (14days): It is at 51.70 indicating a BUY.
Rate of Price Change: It is at 5.19 indicating a BUY.
Moving Averages Convergence Divergence (12,26): It is at 1043.80 indicating a BUY.
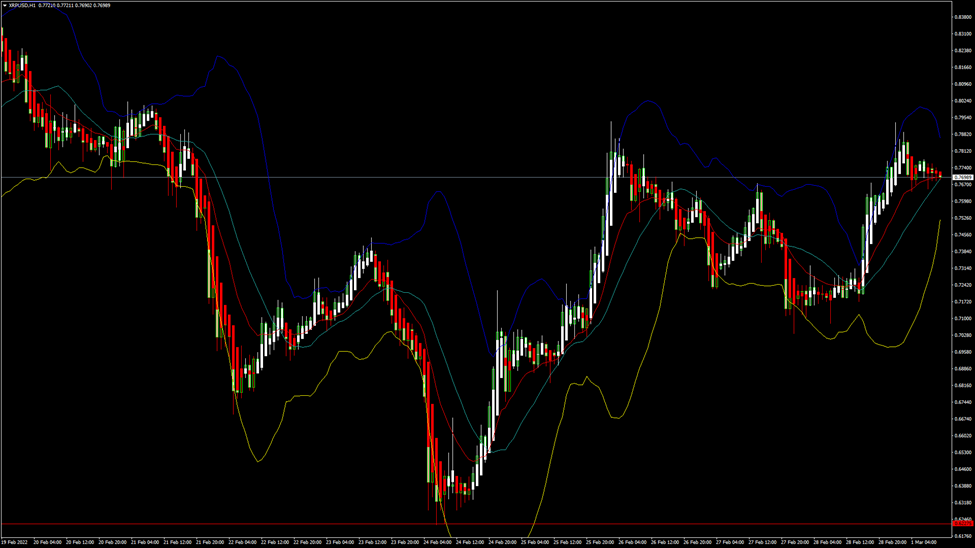
XRPUSD – Double Bottom Pattern Above 0.6200
We can see that the decline in Ripple ended after it touched a low of 0.7036 on 27th February, and now it is moving into a Bullish momentum after crossing the levels of 0.7000
The Bullish momentum that we see today is very strong due to the increased demands of the Ripple globally after the banking sanctions were imposed on Russia.
Ripple is widely used for International Bank to Bank transfers as an alternative to the SWIFT system and after the ban on Russia, the banks are now using the Ripple Networks for transfer of the funds globally.
This has led to increased market demand for Ripple and the Bullish momentum is expected to continue this week.
We can see a Double Bottom pattern above the 0.6200 handles because it signifies an increase in the buying pressure and a shift towards an Uptrend.
The Short-term outlook for Ripple remains Strongly Bullish, the Medium-term outlook remains Bullish, and the Long-Term outlook is Neutral.
The relative Strength Index is at 58 which signifies a STRONG demand for the Ripple at the current market prices and the continuation of the buying pressure.
All of the Moving Averages are giving a STRONG BUY Signal at the current market levels of 0.7696
Ripple is now trading just below its Pivot levels of 0.7717 and is now facing its Classic resistance levels of 0.7751 and Fibonacci resistance levels of 0.7755 after which the path towards 0.8000 will get cleared.
· All of the Technical Indicators are giving a STRONG BUY Signal.
· Ripple continues Bullish momentum above the 0.6200 levels.
· STOCH RSI is giving an OVERSOLD Signal.
· Average True Range indicates LESS Market Volatility.
Ripple Bullish Momentum Seen Above 0.6200
Ripple is now moving into a strong Bullish momentum at the levels above 0.7500 in the European Trading session today.
We can see Parabolic SAR is also indicating a bullish reversal in the markets and a potential target of 0.8200 this week.
The upside bullish projection that is seen in Ripple will result in crossing the levels of 0.8000 after which we can see some short-term correction in its prices.
The price of XRPUSD is UP by 6.09% with a price change of $0.0442 in the past 24hrs and has a trading volume of 3.081 Billion USD.
We can see an increase of 9.04% in the Trading volumes of Ripple as compared to yesterday, which appears to be Normal.
This Week Ahead
The prices of XRPUSD are now moving into a Strong Bullish momentum above the 0.7500 levels and we are expecting a rally towards the 0.8000.
Ripple managed to gain more than 10% from its previous week's losses. With the increase in the prices of Ripple, its market valuation stands now at 37.5 Billion USD.
In this week the prices of Ripple need to remain above the crucial support levels of $0.7000 after which we can see a progression of the Bullish momentum.
The weekly outlook for Ripple is projected at 0.7500 with a consolidation zone of 0.8000
Technical Indicators:
Moving Averages Convergence Divergence (12,26): It is at 0.003 indicating a BUY.
Average Directional Change (14days): It is at 22.48 indicating a BUY.
Commodity Channel Index (14days): It is at 20.34 indicating a NEUTRAL level.
Williams Percent Range: It is at -37.66 indicating a BUY.
This article represents the opinion of the Companies operating under the FXOpen brand only. It is not to be construed as an offer, solicitation, or recommendation with respect to products and services provided by the Companies operating under the FXOpen brand, nor is it to be considered financial advice.
Stay ahead of the market!
Subscribe now to our mailing list and receive the latest market news and insights delivered directly to your inbox.

Latest articles

AUD/USD: Will the RBA Be Able to Keep Its Currency Strong?
As the chart shows, AUD/USD has entered a distinctly bearish phase in recent weeks, reflecting the broader consolidation — and in some cases outright weakness — that the US dollar has begun imposing across most major currency pairs.
Fundamental Analysis
The

AUD/CAD: Pair Remains Range-Bound Amid Interest Rate Divergence
The key macroeconomic factor for AUD/CAD remains the divergence in monetary policy between the two central banks. After three consecutive rate hikes since the beginning of the year, the Reserve Bank of Australia left its cash rate unchanged at

Brent Crude Oil Analysis: Stabilisation or Simply a Pause?
Over the past few weeks, financial markets have been more focused than ever on developments surrounding the Strait of Hormuz — a critical waterway at the centre of ongoing US-Iran negotiations. The back-and-forth of diplomatic headlines has injected significant volatility into