


BTCUSD and XRPUSD Technical Analysis – 15th MAR 2022
FXOpen

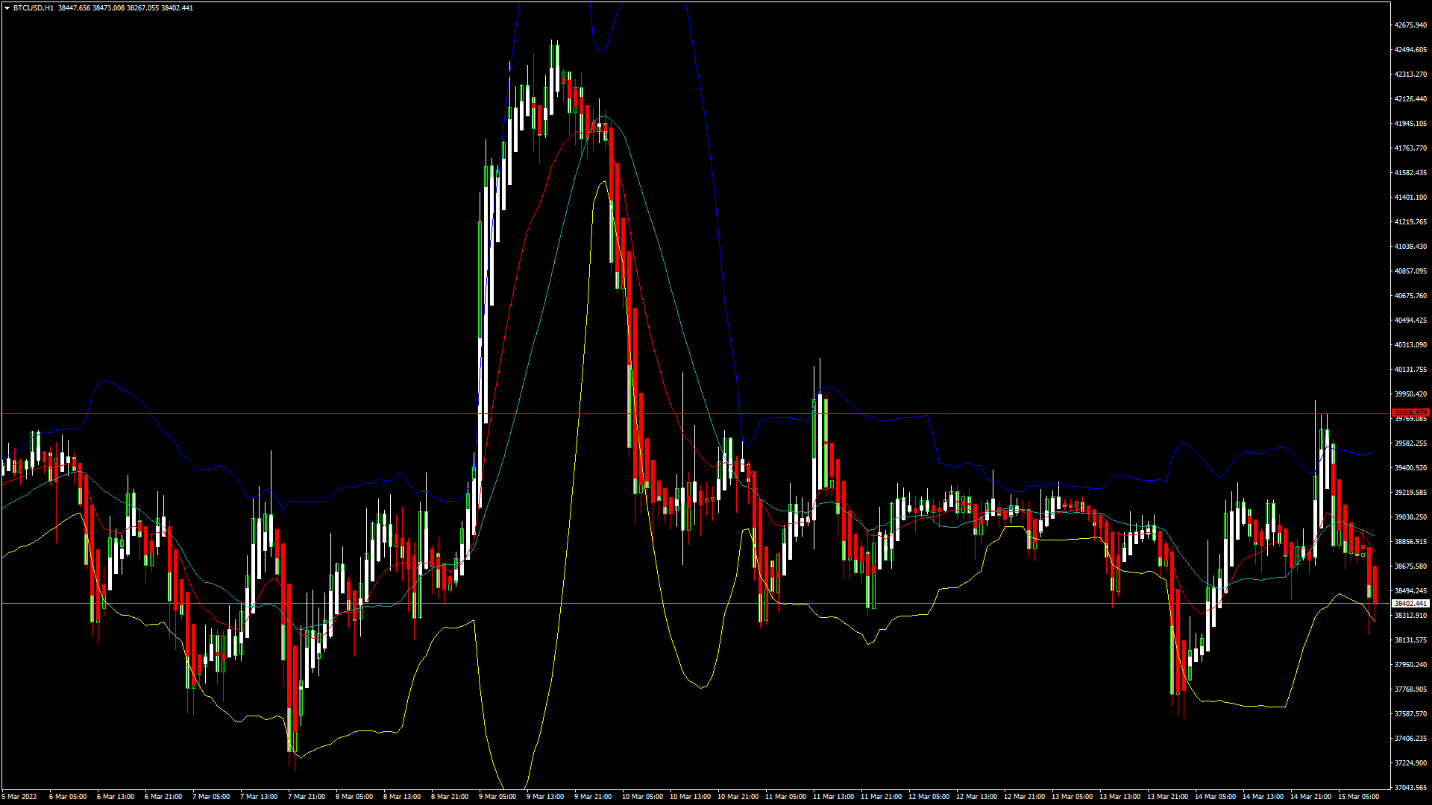
BTCUSD: Double Top Pattern Below $39,800
Bitcoin was unable to continue its bullish momentum last week, and after touching a high of $42,566 on March 9th, started its decline against the US dollar.
The downward phase continues today, and we can see BTCUSD touching $37,500 this week.
Today’s bearish momentum is the result of increased selling by long-term investors due to the continuing war between Russia and Ukraine and its global impact on the safe haven currencies like the US dollar and the yen.
The propagation of the bearish trend continues with bitcoin price trading below the $39,000 mark in today’s European trading session.
We can clearly see a double top pattern below the $39,800 handle which is a Bearish reversal pattern because it signifies the end of an uptrend and a shift towards a downtrend.
The StochRSI is indicating an OVERSOLD level which means that in the immediate short-term, an upwards correction in the prices is expected.
The relative strength index is at 39 indicating a WEAK demand for bitcoin at the current market levels.
Bitcoin is now moving below its 100 hourly simple moving average and below its 200 hourly exponential moving averages.
All of the major technical indicators are giving a STRONG SELL signal, which means that in the immediate short-term we are expecting targets of $37,000 and $36,500.
The average true range is indicating HIGH market volatility with a strong bearish momentum.
- A bearish reversal is seen in bitcoin below $39,900
- The Williams percent range is indicating an OVERBOUGHT level
- The price is now trading just below its pivot level of $38,490
- All of the moving averages are giving a STRONG SELL market signal
Bitcoin: Bearish Momentum Seen Below $39,900
In today’s European trading session, bitcoin continues to move in a strongly bearish momentum with a downside projection towards the level of $36,000.
In the immediate term we are expecting a continuation of this bearish trend, with the prices of bitcoin ranging between the levels of $35,000 and $38,000 as it is due to enter into a consolidation phase now.
The short-term risks have increased for bitcoin, and the selling pressure is expected to continue pushing down the prices below $38,000 today.
The immediate short-term outlook for bitcoin is strongly bearish, the medium-term outlook is bearish, and the long-term outlook remains neutral under present market conditions.
The price of BTCUSD is now facing its classic support level of $37,591 and Fibonacci support level of $38,265 after which the path towards $36,000 will get cleared.
We can see that the daily RSI is also printing at 45 which indicates that in the medium-term prices are expected to fall further.
In the last 24hrs BTCUSD has gone down by -1.49% with a price change of 582$ and has a 24hr trading volume of USD 23.987 billion. We can see an increase of 5.93% in the trading volume as compared to yesterday, which appears to be normal.
The Week Ahead
The prices of bitcoin are due to enter into a consolidation phase below $38,000. We can see some range-bounded movements between $35,000 to $38,000.
We can see that market volatility is increasing due to the global war crisis between Russia and Ukraine and its ripple effects on the major currencies and oil sector.
In the immediate short-term, bitcoin’s bearish momentum is expected to continue pushing below the $36,000 handle this week.
The prices of BTCUSD will need to remain above the important support levels of $35,000 this week.
Weekly outlook is projected at $36,000 with a consolidation zone of $37,500.
Technical Indicators:
The relative strength index (14-day): at 39.91 indicating a SELL
The average directional change (14-day): at 24.86 indicating a SELL
The rate of price change: at -0.937 indicating a SELL
The moving averages convergence divergence (12,26): at -45.00 indicating a SELL
XRPUSD: Double Top Pattern Below 0.7700
Ripple was unable to sustain its bullish momentum against the US dollar, and after touching a high of 0.8450 on March 12th, started its decline below 0.8000.
Ripple’s decline continues today after it touched a low of 0.7473 in the Asian trading session.
The bearish momentum that we are observing today is very strong due to the increased selling seen across the global cryptocurrency exchanges worldwide.
We can clearly see a double top pattern below the 0.7700 handle which signifies the end of an uptrend and a shift towards a downtrend.
The short-term outlook for Ripple remains strongly bearish, the medium-term outlook remains bearish, and the long-term outlook is neutral.
The relative strength index is at 35 which signifies a WEAK demand for Ripple at the current market prices and the continuation of the selling pressure.
All of the moving averages are giving a STRONG SELL signal at the current market levels of 0.7480.
Ripple is now trading below its pivot level of 0.7531, and facing its classic support level of 0.7350 and Fibonacci support level of 0.7486, after which the path towards 0.7200 will get cleared.
- All of the technical indicators are giving a STRONG SELL signal
- Ripple continues its bearish momentum below 0.7700
- The StochRSI is giving an OVERSOLD signal
- The average true range indicates LESSENED market volatility
Ripple: Bearish Momentum Seen Below 0.7700

Ripple is now moving into a strong bearish momentum at the levels below 0.7500 in the European trading session today.
We can see the prices of Ripple are struggling to gain any bullish momentum and this indicates that the selling pressure will continue this week.
The downside bearish projection that is seen in Ripple will result in its value declining below the level of 0.7000 after which we may see some short-term correction in its prices.
The price of XRPUSD has gone down by 2.84% with a price change of $0.02188 in the past 24hrs, and has a trading volume of 1.994 billion USD.
We can see a decrease of 17.01 in the trading volumes of Ripple as compared to yesterday, which appears to be normal.
This Week Ahead
The prices of XRPUSD are now moving into a strong bearish momentum below the 0.7700 levels, and we are expecting more downwards pressure towards 0.7000.
We can see that the global crisis led by the Russia-Ukraine war continues to affect the prices of leading cryptocurrencies including Ripple as the long-term investors are not willing to enter the markets now.
In this week the prices of Ripple need to remain above the crucial support level of $0.7000 after which we can see a progression of the bullish momentum.
The weekly outlook for Ripple is projected at 0.7200 with a consolidation zone of 0.7000.
Technical Indicators:
The moving averages convergence divergence (12,26): at -0.004 indicating a SELL
The average directional change (14-day): at 26.43 indicating a SELL
The commodity channel index (14-day): at -174.54 indicating a SELL
The ultimate oscillator: at 45.16 indicating a SELL
FXOpen offers the world's most popular cryptocurrency CFDs*, including Bitcoin and Ethereum. Floating spreads, 1:2 leverage — at your service (additional fees may apply). Open your trading account now or learn more about crypto CFD trading with FXOpen.
*Important: At FXOpen UK, Cryptocurrency trading via CFDs is only available to our Professional clients. They are not available for trading by Retail clients. To find out more information about how this may affect you, please get in touch with our team.
This article represents the opinion of the Companies operating under the FXOpen brand only. It is not to be construed as an offer, solicitation, or recommendation with respect to products and services provided by the Companies operating under the FXOpen brand, nor is it to be considered financial advice.
Stay ahead of the market!
Subscribe now to our mailing list and receive the latest market news and insights delivered directly to your inbox.


Latest articles

DAX 40: Can the Index Print Fresh Record Highs Once Again?
The DAX 40 has shed more than 2% over the past several sessions, breaking a rally that had pushed the index to record highs on the back of Germany's fiscal pivot toward defence, infrastructure and climate spending. The pullback raises

US Dollar Consolidates Ahead of FOMC Minutes Release
The US dollar has entered a period of consolidation following last week's sharp price swings, as market participants turn their attention to the release of the Federal Reserve's latest meeting minutes. Investors are looking for additional guidance on the future

EUR/USD Analysis: Who Is in Control?
Two central banks, two hawkish tones — but only one dollar just took a hit. The ECB delivered a 25bp hike in June, its first since 2023, lifting the deposit rate to 2.25% as Middle East-driven energy costs pushed headline