


BTCUSD and XRPUSD Technical Analysis – 15th FEB 2022
FXOpen
BTCUSD: Bullish Engulfing Pattern Above $41,500
Bitcoin touched a high of $45,807 on February 10, after which it started to decline touching a low of $41,601 in the Asian trading session today.
Now the prices have entered into a bullish correction phase and continue to remain above the $43,000 handle in the European trading session.
We can see a recovery in the prices of bitcoin towards $44,000,and this fresh wave of correction is expected to push up its prices towards $47,000.
We can clearly see a bullish engulfing pattern above the $41,500 handle which is a bullish reversal pattern because it signifies the end of a downtrend and a shift towards an uptrend.
Both Stoch and StochRSI are indicating an OVERBOUGHT level, meaning that in the immediate short-term, a decline in the prices is expected.
The relative strength index is at 71 indicating a STRONGER demand for bitcoin at the current market levels.
Bitcoin is now moving above its 100 hourly simple moving average and below its 200 hourly exponential moving average.
All of the major technical Indicators are giving a STRONG BUY signal, which means that in the immediate short-term we are expecting targets of $45,000 and $47,000.
The average true range is indicating lesser market volatility with a strong bullish momentum.
- A bitcoin bullish reversal is observed above $41,500
- The Williams percent range is indicating an OVERBOUGHT level
- The price is now trading just below its pivot level of $43,940
- All of the moving averages are giving a STRONG BUY market signal
Bitcoin: Bullish Reversal Seen Above $41,500
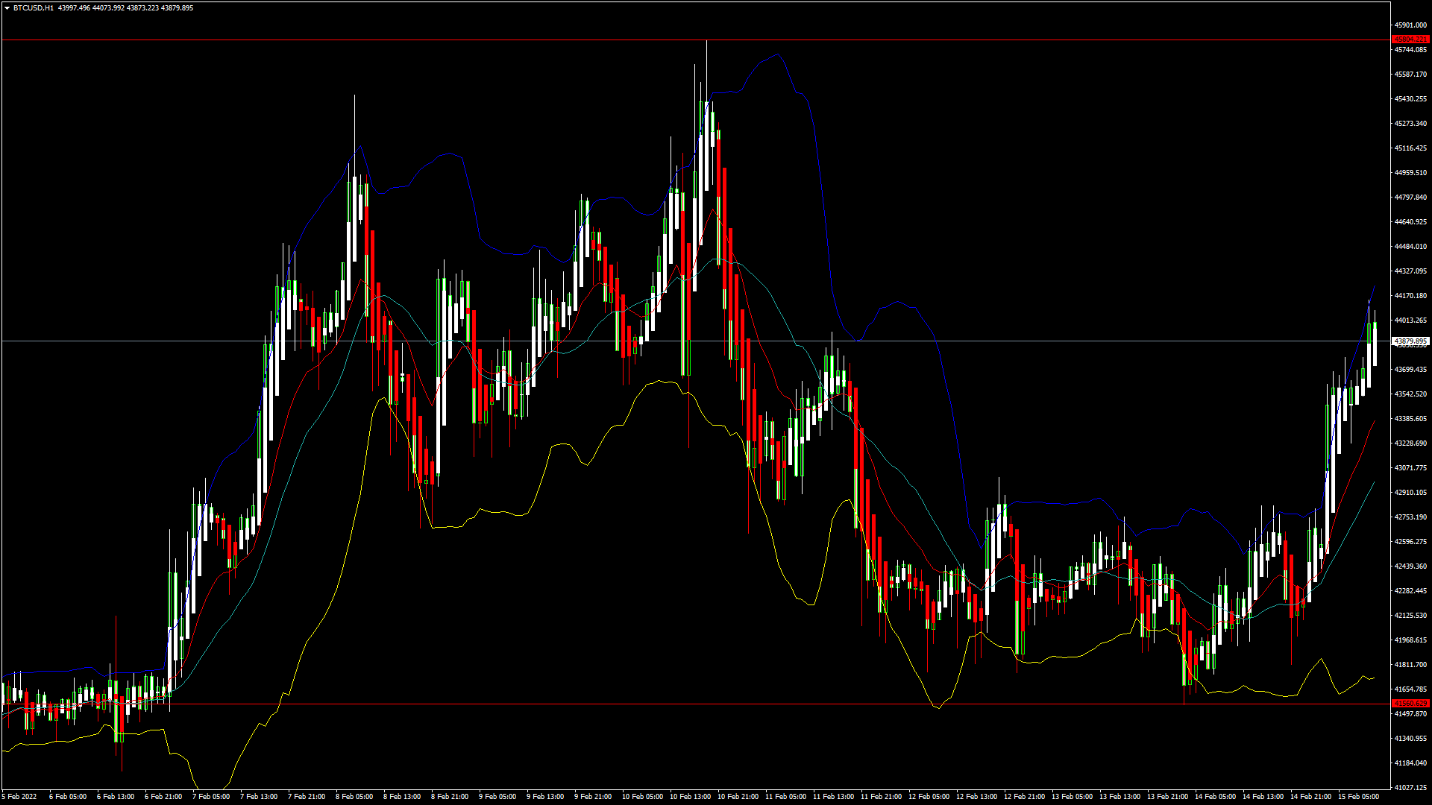
Bitcoin continues to move in a strong bullish momentum after its decline towards the $41,600 level, and is now moving into a bullish zone formation above $43,000.
The immediate short-term outlook for bitcoin is strongly bullish; the medium-term outlook is neutral; the long-term outlook remains bullish.
We can see that the daily 100-day and 200-day simple moving averages are indicating a trend reversal at the levels of $48,177 and 49,416, which means that after touching these levels a contraction/ correction in bitcoin prices is expected.
The price of BTCUSD is now facing its classic resistance level of $44,233, and Fibonacci resistance level of $44,452, after which the path towards $47,000 will get cleared.
Bitcoin has already managed to cross its initial resistance zone of $43,800, and is moving upwards closer to $44,000.
In the last 24hrs, BTCUSD has gone UP by 4.58% with a price change of 1,926$, and has a 24hr trading volume of USD 24.019 billion. We can see an increase of 34.58% in the trading volume as compared to yesterday, due to increased buying pressure in the global cryptocurrency markets.
The Week Ahead
The prices of bitcoin are at present moving in a correction phase towards the $44,000 handle. This also indicates that now we are looking at a fresh rally into the markets towards $50,000.
The prices of bitcoin remained under pressure last week due to the fresh concerns over the Russia-Ukraine border tensions, which, to date, has resulted in the US dollar getting stronger due to safe haven demands and the price of BTCUSD going down.
In the immediate short-term, bitcoin’s bullish momentum is expected to continue pushing past the $47,000 handle this week.
The price of BTCUSD will need to remain above the important support level of $43,000 this week, and we can expect more upsides in the range of $45,000 to $47,000 the next week.
Bitcoin vs GOLD
Traditionally, gold has been considered a safe preferred by global investors for long-term holdings of their wealth. But now we can see a shift in the sentiment towards bitcoin as a viable digital gold, thanks to higher appreciation and gains.
Crypto investors now prefer buying bitcoin at lower levels, and we can see that now the total market capitalization of bitcoin stands at 832 billion USD.
Technical Indicators:
The commodity channel index (14-day): at 103.36 indicating a BUY
The average directional change (14-day): at 29.93 indicating a BUY
The rate of price change: at 4.306 indicating a BUY
The moving averages convergence divergence (12,26): at 414.10 indicating a BUY
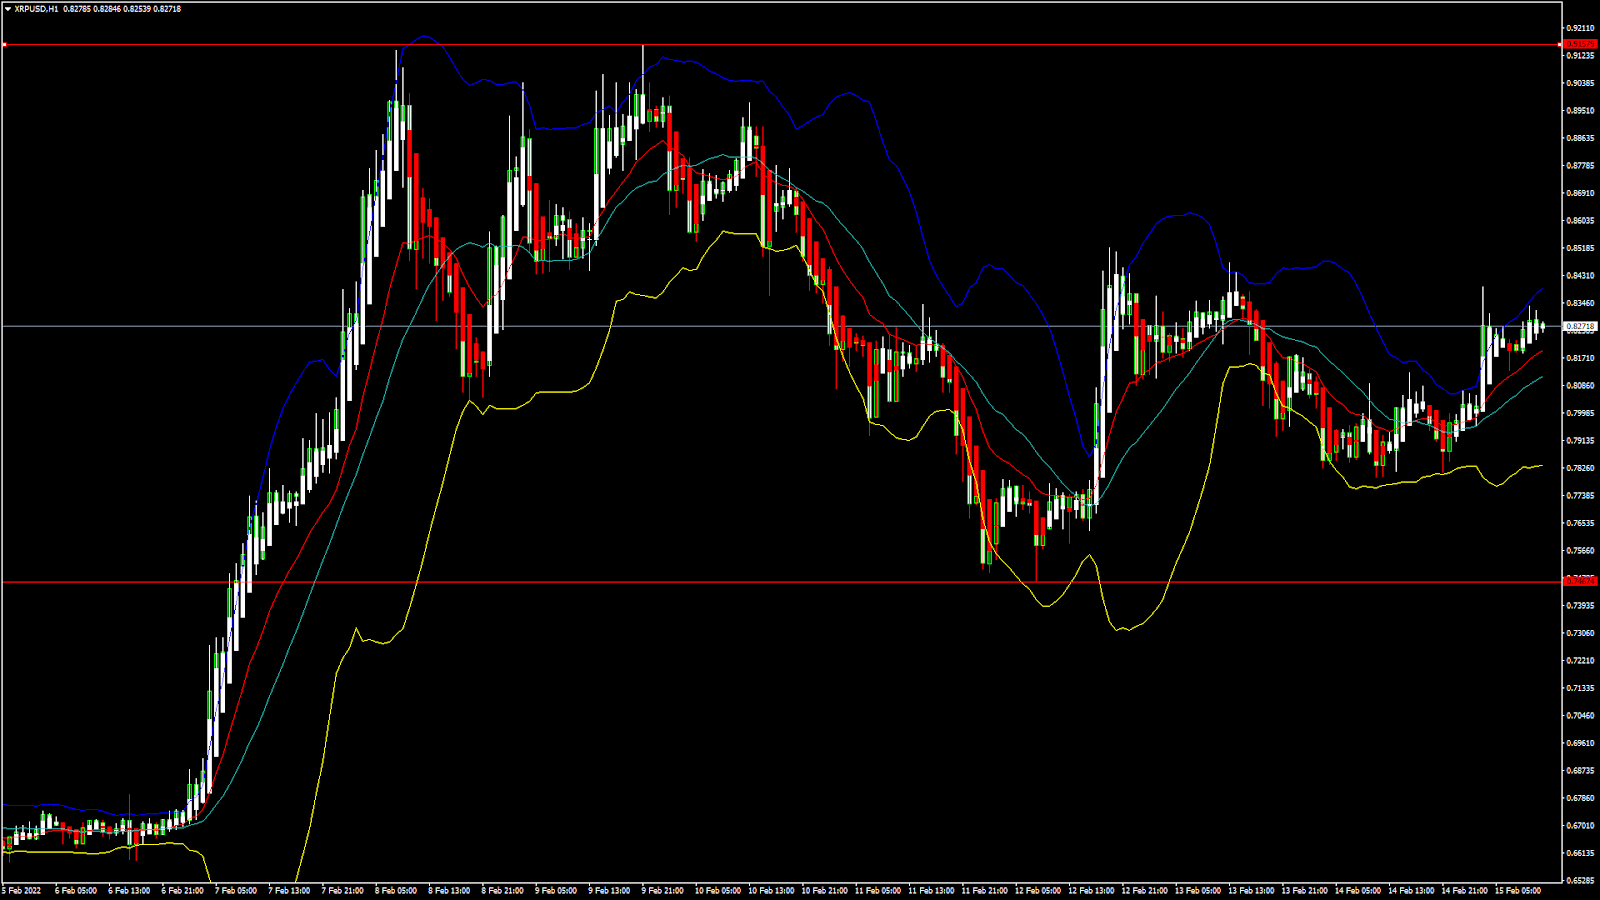
XRPUSD: Bullish Engulfing Pattern Above 0.7400
Ripple touched a high of 0.9139 on February 8, then started to decline and touched a low of 0.7466 on February 12. Currently, the price of Ripple has entered a consolidation channel above the 0.7400 handle.
In today’s Asian trading session, Ripple touched an intraday high of 0.8375 and continues to remain above 0.8000.
We can clearly see a bullish engulfing pattern above the 0.7400 handle because it signifies an increase in the buying pressure and a shift towards an uptrend.
The short-term outlook for Ripple remains bullish; medium-term outlook remains neutral; and the long-term outlook is strongly bullish.
The relative strength index is at 60 which signifies a STRONG demand for Ripple at the current market prices. All of the moving averages are giving a STRONG BUY signal at the current market level of 0.8273.
Ripple is now trading just below its pivot level of 0.8285, and now facing its classic resistance level of 0.8329 and fibonacci resistance level of 0.8372 in the European trading session.
- All of the technical indicators are giving a STRONG BUY signal
- Ripple continues its bullish momentum above 0.7400
- StochRSI is giving an OVERBOUGHT signal
- The average true range indicates LESS market volatility
Ripple Continues Bullish Momentum Above 0.7400
In today’s European trading session, Ripple has been moving in a correction wave above the 0.7400 handle.
We can see bullish trendline formation in place which is keeping the prices of XRPUSD above the level of 0.8000
We have detected a bullish harami pattern in the 15-minute and 30-minute time frames which is a signal that the bullish pattern continues in the short-term.
The 100-day simple moving average (daily) and the 200-day simple moving averages are indicating a reversal at the levels of 0.8560 and 0.9628 which means that after touching these levels, a correction/ contraction in the prices of Ripple is expected.
The price of XRPUSD has gone UP 5.66% with a price change of $0.04137 in the past 24hrs, and has a trading volume of 2.424 billion USD.
We can see a decrease of 9.89% in the trading volumes of Ripple as compared to yesterday, which appears to be normal.
This Week Ahead
The price of XRPUSD is now moving into a strong bullish correction wave which is expected to push its price above the 0.8500 handle.
The recent decline that we saw in the levels of Ripple when it touched a low of 0.7466 occurred due to the ongoing Russia-Ukraine border tensions and its effects on the USD.
This week, the prices of Ripple need to remain above the crucial support level of $0.8000 after which we may see a progression of the bullish momentum.
The weekly outlook for Ripple is projected at 0.8500 with a consolidation zone of 0.8800.
Technical Indicators:
Moving averages convergence divergence (12,26): at 0.029 indicating a BUY
STOCH (9,6): at 62.06 indicating a BUY
Commodity channel index (14-day): at 60.03 indicating a BUY
Rate of price change: at 31.65 indicating a BUY
FXOpen offers the world's most popular cryptocurrency CFDs*, including Bitcoin and Ethereum. Floating spreads, 1:2 leverage — at your service (additional fees may apply). Open your trading account now or learn more about crypto CFD trading with FXOpen.
*Important: At FXOpen UK, Cryptocurrency trading via CFDs is only available to our Professional clients. They are not available for trading by Retail clients. To find out more information about how this may affect you, please get in touch with our team.
This article represents the opinion of the Companies operating under the FXOpen brand only. It is not to be construed as an offer, solicitation, or recommendation with respect to products and services provided by the Companies operating under the FXOpen brand, nor is it to be considered financial advice.
Stay ahead of the market!
Subscribe now to our mailing list and receive the latest market news and insights delivered directly to your inbox.


Latest articles

DAX 40: Can the Index Print Fresh Record Highs Once Again?
The DAX 40 has shed more than 2% over the past several sessions, breaking a rally that had pushed the index to record highs on the back of Germany's fiscal pivot toward defence, infrastructure and climate spending. The pullback raises

US Dollar Consolidates Ahead of FOMC Minutes Release
The US dollar has entered a period of consolidation following last week's sharp price swings, as market participants turn their attention to the release of the Federal Reserve's latest meeting minutes. Investors are looking for additional guidance on the future

EUR/USD Analysis: Who Is in Control?
Two central banks, two hawkish tones — but only one dollar just took a hit. The ECB delivered a 25bp hike in June, its first since 2023, lifting the deposit rate to 2.25% as Middle East-driven energy costs pushed headline