


BTCUSD and XRPUSD Technical Analysis – 14th DEC, 2021
FXOpen

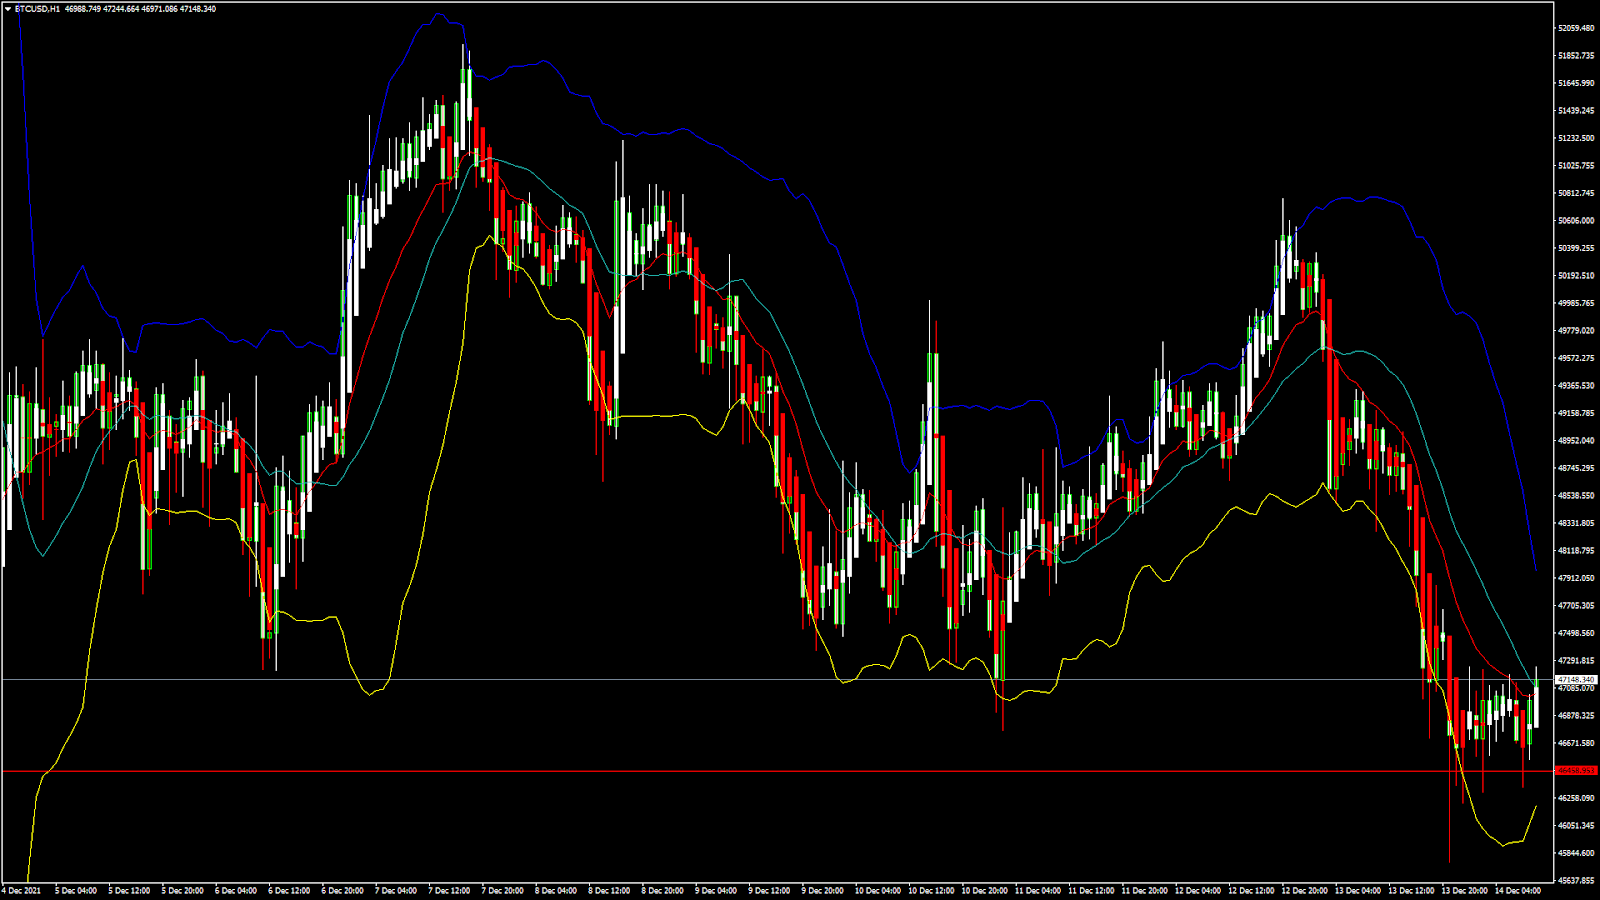
BTCUSD: Head and Shoulders Pattern Below $50,000
Bitcoin was unable to sustain its bullish momentum on 12th Dec and declined after having touched a high of $50,701. We can observe a continuous fall since it touched its all-time high of $59,119 on 30th Nov.
This fall in BTCUSD can also be attributed to the broad-based December selling in crypto markets; this is a time when global investors seem to withdraw their profits and investments due to the upcoming Christmas and New Year holiday season.
In today’s European trading session, bitcoin is again back in the bearish channel, trading below the $50,000 handle.
We can clearly see a head-and-shoulders pattern below the $50,000 handle which signifies a fall in the price of Bitcoin and a continuation of the bearish downtrend.
At present, the price of bitcoin has entered a consolidation phase below the $48,000, and this is expected to continue in the US trading session.
Both the Stoch and StochRSI are indicating an OVERBOUGHT level, which means that in the immediate short-term, a decline in the price is expected.
Bitcoin is moving below its both 100 hourly simple and exponential moving averages.
The average true range is indicating a lesser market volatility, which means that markets will be entering a consolidation phase soon.
- Bitcoin trend reversal is seen below $50,000
- Stoch is indicating an OVERBOUGHT level
- The price is now trading just above its pivot level of $46,895
- All the moving averages are giving a SELL signal at current market level of $47,146
Bitcoin: Bearish Momentum Below $50,000 Confirmed
BTCUSD is struggling to keep itself above the $50,000 mark, and we can see a mild bullish channel which suggests that a further decline can be expected.
Some of the major technical indicators are giving a SELL signal, which means that the price will fall below $45,000 soon.
In the European trading session, the price of BTCUSD is trading above its classic support level of $46,708 and Fibonacci support level of $46,594.
In the last 24hrs, BTCUSD has gone DOWN by 3.74% with a price change of $1,830, and has a 24hr trading volume of USD 33.547 billion. Compared to yesterday, there was a 41.25% increase in the trading volume. This increase happened thanks to the increased selling pressure, as well as liquidation of bitcoin holdings by investors.
The Week Ahead
Bitcoin continues tumbling down from its Nov 30th all-time high of $59,119. A further decline will push it below the $45,000 handle.
The medium to long-term outlook remains BULLISH for bitcoin, with a target of $55,000. At present, the markets are giving a SELL signal, so it would be best to enter into short positions.
The relative strength index of 42 is indicating a bearish channel, and fresh selling is expected in the markets at any time. This is also due to the renewed fears related to the Omicron coronavirus variant, and many countries shutting down their international borders.
Technical Indicators:
Stoch (9,6): at 98.95 indicating an OVERBOUGHT level
Average directional change (14-day): at 42.60 indicating a SELL
Rate of price change: at -0.837 indicating a SELL
Moving averages convergence divergence (12,26): at -447.70 indicating a SELL
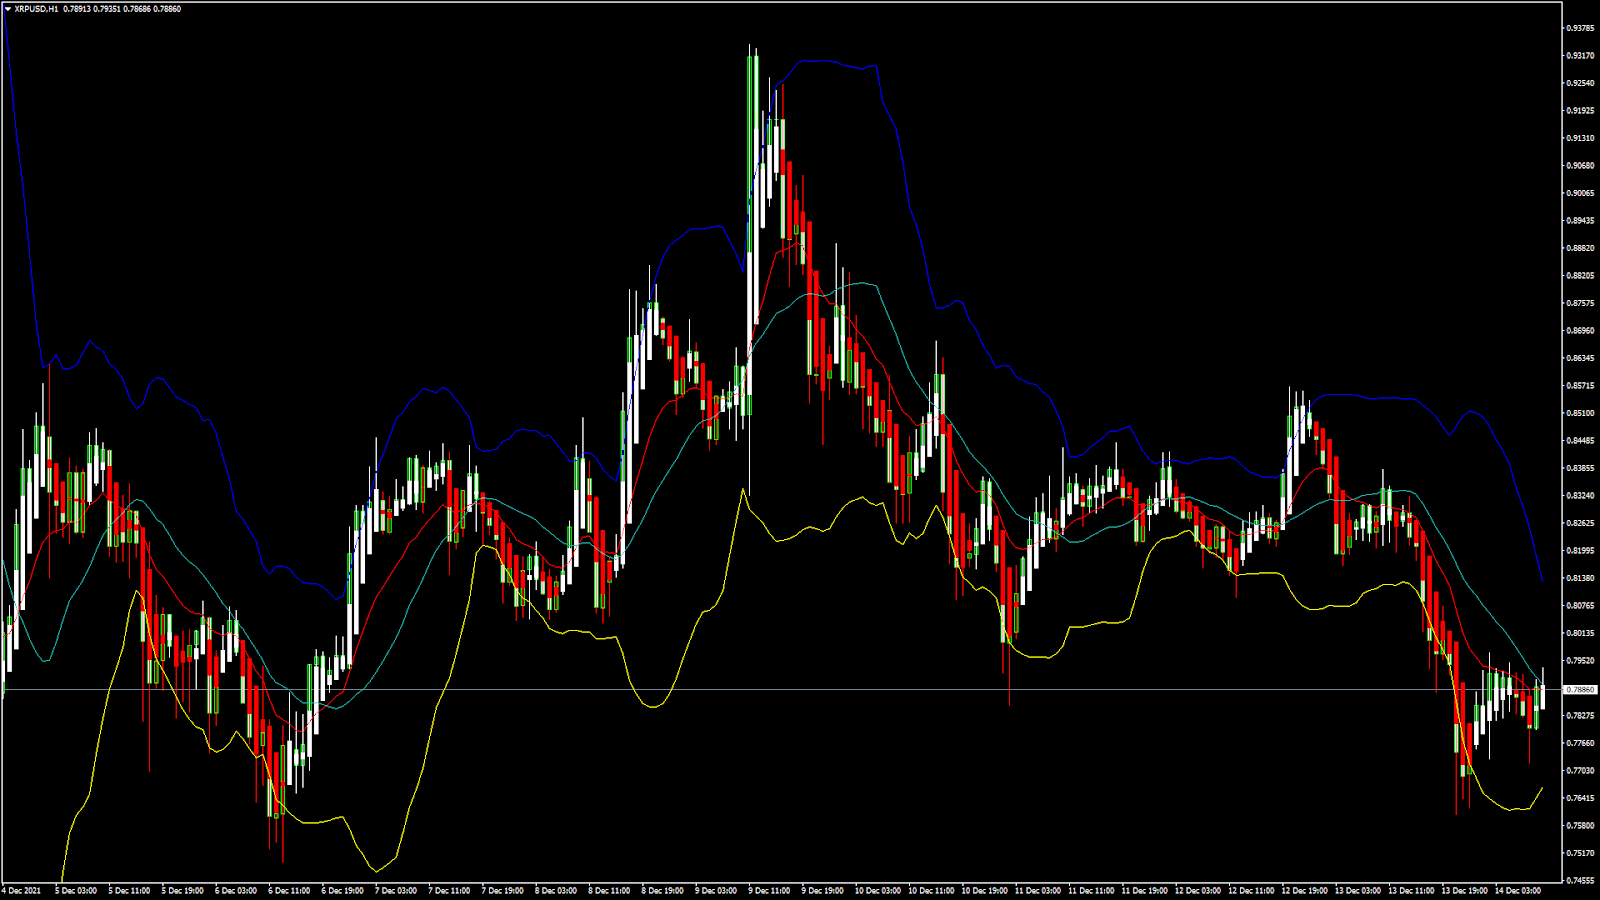
XRPUSD: Head and Shoulders Pattern Below 0.8500
We have seen the price of Ripple continue its downtrend from the Nov 15th high of 1.2175. This continuous fall can be attributed to the broad-based selling seen in crypto markets, and profit-taking by long-term investors.
We can clearly see a head-and-shoulders pattern form below the 0.8500 level, which signifies a bearish market and a continuation of the downtrend.
In yesterday’s US trading session, we saw Ripple touch an intraday high of 0.8563, after which it declined to a low of 0.7623.
Ripple is now moving into a consolidation phase below 0.8000, and we will have to wait till we can see clearer signals.
The short-term outlook for Ripple has turned bearish; the medium-term outlook appears bullish; and the long-term outlook is strongly bullish.
Ripple is now trading just above its pivot level of 0.7864, remaining above its classic support level of 0.7821 and Camarilla support level of 0.7876 in the European trading session.
- All technical indicators are giving a MIXED signal
- Ripple has entered into a BEARISH channel below 0.8500
- All the moving averages are giving a SELL signal
- The average true range indicates LESS market volatility
Ripple: Bearish Trend Below 0.8500 Confirmed
Ripple continues its losses from its November high of 1.2175, and we can still see a downward selling pressure which can be explained by the negative news about the pending case of the Securities and Exchange commission vs Ripple Labs.
LESS market volatility is observed today which means the market has entered a consolidation phase.
The technical indicators are giving a MIXED signal, while moving averages indicate a SELL, meaning that the price of Ripple is due to enter into a stronger downwards correction in today’s US trading session.
In the past 24hrs, the price of XRPUSD has gone DOWN by 5.38% with a price change of -$0.0453, and has a trading volume of 3.009 billion USD. We can also see a 74.07% increase in Ripple’s trading volumes.
This increase in Ripple’s trading volume is due to the heavy-selling pressure by global Investors who are liquidating their holdings faced with Omicron fears and the end of year season.
This Week Ahead
Ripple price is struggling to gain a bullish momentum against the US dollar and bitcoin. We can see a slide in the prices of Ripple across major cryptocurrency exchanges today.
At present, the markets are in the consolidation phase, and we will need to wait till the clear signals emerge for long-term traders.
We can expect the price of Ripple touching 0.7500 this week before any indication of a bullish reversal.
Technical Indicators:
Moving averages convergence divergence (12,26): at -0.007 indicating a SELL
Average directional change (14-day): at 34.15 indicating a SELL
Relative strength index (14-day): at 44.85 indicating a SELL
Rate of price change: at -0.467 indicating a SELL
FXOpen offers the world's most popular cryptocurrency CFDs*, including Bitcoin and Ethereum. Floating spreads, 1:2 leverage — at your service (additional fees may apply). Open your trading account now or learn more about crypto CFD trading with FXOpen.
*Important: At FXOpen UK, Cryptocurrency trading via CFDs is only available to our Professional clients. They are not available for trading by Retail clients. To find out more information about how this may affect you, please get in touch with our team.
This article represents the opinion of the Companies operating under the FXOpen brand only. It is not to be construed as an offer, solicitation, or recommendation with respect to products and services provided by the Companies operating under the FXOpen brand, nor is it to be considered financial advice.
Stay ahead of the market!
Subscribe now to our mailing list and receive the latest market news and insights delivered directly to your inbox.


Latest articles

AUD/USD: Will the RBA Be Able to Keep Its Currency Strong?
As the chart shows, AUD/USD has entered a distinctly bearish phase in recent weeks, reflecting the broader consolidation — and in some cases outright weakness — that the US dollar has begun imposing across most major currency pairs.
Fundamental Analysis
The

AUD/CAD: Pair Remains Range-Bound Amid Interest Rate Divergence
The key macroeconomic factor for AUD/CAD remains the divergence in monetary policy between the two central banks. After three consecutive rate hikes since the beginning of the year, the Reserve Bank of Australia left its cash rate unchanged at

Brent Crude Oil Analysis: Stabilisation or Simply a Pause?
Over the past few weeks, financial markets have been more focused than ever on developments surrounding the Strait of Hormuz — a critical waterway at the centre of ongoing US-Iran negotiations. The back-and-forth of diplomatic headlines has injected significant volatility into