


BTCUSD and XRPUSD Technical Analysis – 11th JAN 2022
FXOpen
BTCUSD: Double Bottom Pattern Above $40,000
Bitcoin could not sustain its bullish momentum and started to decline after touching a high of $47,527 on 3rd January due to the heavy selling pressure that was observed across global cryptocurrencies in the first week of 2022.
The price of BTCUSD broke the $40,000 handle yesterday, touching a low of $39,719 in the European trading session. Also today, we could see some pullback action in the European trading session, and the prices of BTCUSD are ranging above the $40,000 handle.
A double bottom pattern is clearly seen above $40,000, which signifies the end of a downtrend and a shift towards an uptrend.
Stoch is indicating an OVERBOUGHT market, so a decline is expected to occur in the immediate short-term.
The relative strength index is at 54, indicating a NEUTRAL market and a move towards a market consolidation phase.
Bitcoin is now moving above its 100 hourly simple moving average and below its 200 hourly exponential moving average.
The average true range is indicating a lesser market volatility, meaning that markets are due to enter into a consolidation phase.
- Bitcoin trend reversal seen above $40,000
- Williams percent range indicating an OVERBOUGHT level
- The price is now trading below its pivot levels of $42,196
- Most of the moving averages are giving a BUY market signal
Bitcoin: Bullish Reversal Above $40,000 Confirmed

In today’s European trading session, bitcoin is forming a bullish reversal pattern as the prices continue to uptick.
The immediate short-term outlook for bitcoin is mildly bullish, the medium-term outlook is neutral, and the long-term outlook remains bullish.
All of the major technical Indicators are giving a STRONG BUY signal, which means that in the immediate short-term we should expect targets of $43,000 and $44,000.
The price of BTCUSD is now facing its classic resistance level of $42,294 and Fibonacci resistance level of $42,368, after which the path towards $43,000 will get cleared.
In the last 24hrs, BTCUSD has gone UP by 0.55% with a price change of 232$, and has a 24hr trading volume of USD 33.986 billion. We can see an Increase of 60.84% in the trading volume as compared to yesterday. This increase is happening thanks to the strengthened buying pressure seen after the recent bitcoin’s decline.
The Week Ahead
The price of bitcoin has already touched a 5-month low, sliding below the $40,000 handle. At the start of 2022, such a decline signifies a weaker demand for bitcoin from global investors.
We can see that the prices of BTCUSD have stabilized and are moving in a mildly bullish channel in the European trading session today.
If the prices continue to remain above the important support level of $42,000, we could see an upside correction towards $44,000 this week.
BTC declines more than 40% from 2021 highs
In November 2021, we saw bitcoin touched an all-time high of $68,984; looking at this year’s low of $39,719, we can see a decline by 42%. This also explains the highly volatile nature of bitcoin. Looking at these numbers, many investors are not willing to enter into bitcoin markets.
The above reasons also led to the decline in the total market capitalization of bitcoin to below 800 billion USD.
Technical Indicators:
Commodity channel index (14-day): at 98.97 indicating a BUY
Average directional change (14-day): at 40.05 indicating a BUY
Rate of price change: at 1.114 indicating a BUY
StochRSI (14-day): at 67.04 indicating a BUY
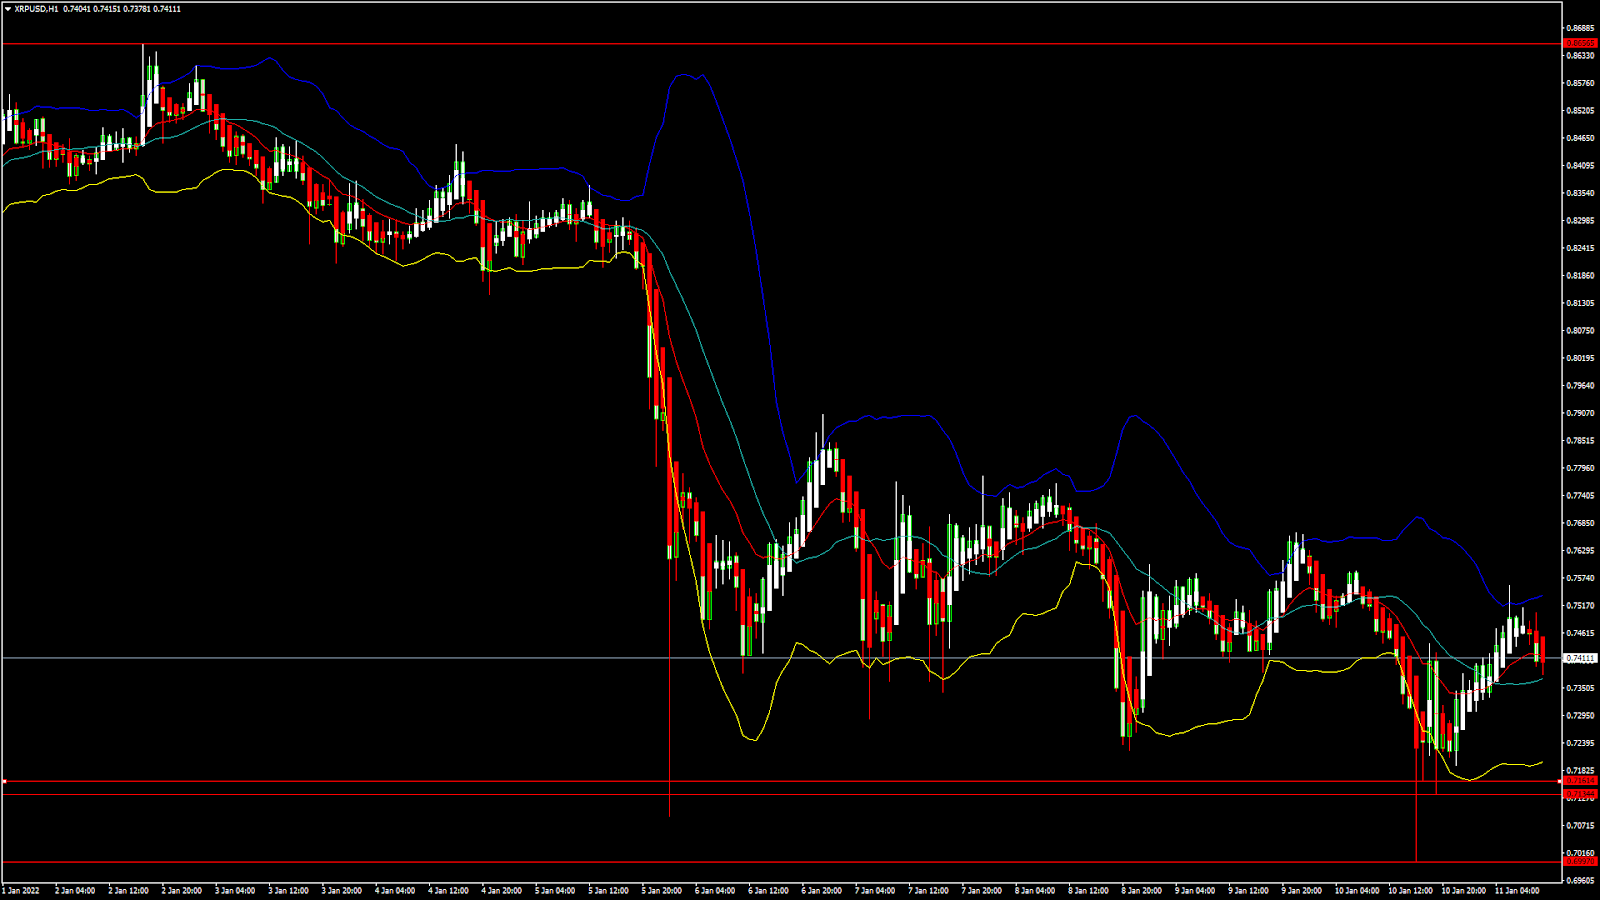
XRPUSD: Double Bottom Pattern Above 0.7100
In the US trading session, Ripple was moving into a wave of consolidation after which we saw a decline yesterday when it touched a low of 0.7009.
In today’s Asian trading session, the price of Ripple is moving in a mildly bullish channel, having touched an intraday high of 0.7558.
We can clearly see a double bottom pattern above 0.7100, which is a bullish reversal pattern signifying the end of a downtrend and a shift towards an uptrend.
The short-term outlook for Ripple has turned mildly bullish; the medium-term outlook remains neutral; and the long-term outlook is strongly bullish.
The relative strength index is below 50 which signifies a NEUTRAL market. We have also detected an MA 20 crossover pattern, which is a bullish reversal pattern.
Ripple is now trading just below its pivot level of 0.7434; it is now facing its classic resistance level of 0.7471 and Fibonacci resistance level of 0.7533 in the European trading session.
- All technical indicators are giving a BUY signal
- Ripple has entered into a mildly bullish channel above 0.7100
- Commodity channel index is giving a NEUTRAL signal
- Average true range indicates LESS market volatility
Ripple: Bullish Reversal Above 0.7100 Confirmed
Ripple is now moving into a consolidation channel above 0.7300, and we can see an upside progression which is expected to push its prices towards the 0.8000 handle.
The downside risks in XRPUSD have been minimized, and we can observe the mild bullish reversal pattern confirmed by the MA 20 crossover pattern.
The price of XRPUSD has gone DOWN by -0.75% with a price change of $-0.005576 in the past 24hrs, and has a trading volume of 2.334 billion USD.
We can see a 94.56% increase in the trading volumes of Ripple in the last 24 hours. This increase occurred due to the renewed buying pressure after the prices touched a low of 0.7009 yesterday.
This Week Ahead
The price of XRPUSD has started to move in a mildly bullish channel, and we could see 0.7500 in the US trading session.
The overall outlook for Ripple remains NEUTRAL at present market conditions.
Ripple needs to remain above its important support level of 0.7000 after which more buyers are expected to return to the market.
XRP has already declined by more than 27% after touching a high of 1.01634 on 23rd Dec, 2021.
The market sentiment has improved after the selloff; now, we are looking at a fresh rally on the markets.
The weekly outlook for Ripple is projected to reach from 0.8000 to 0.8200.
Technical Indicators:
Moving averages convergence divergence (12,26): at 0.000 indicating a NEUTRAL market
Williams percent range: at -42.45 indicating BUY
Average directional change (14-day): at 38.20 indicating a BUY
Rate of price change: at 2.445 indicating a BUY
FXOpen offers the world's most popular cryptocurrency CFDs*, including Bitcoin and Ethereum. Floating spreads, 1:2 leverage — at your service (additional fees may apply). Open your trading account now or learn more about crypto CFD trading with FXOpen.
*Important: At FXOpen UK, Cryptocurrency trading via CFDs is only available to our Professional clients. They are not available for trading by Retail clients. To find out more information about how this may affect you, please get in touch with our team.
This article represents the opinion of the Companies operating under the FXOpen brand only. It is not to be construed as an offer, solicitation, or recommendation with respect to products and services provided by the Companies operating under the FXOpen brand, nor is it to be considered financial advice.
Stay ahead of the market!
Subscribe now to our mailing list and receive the latest market news and insights delivered directly to your inbox.


Latest articles

DAX 40: Can the Index Print Fresh Record Highs Once Again?
The DAX 40 has shed more than 2% over the past several sessions, breaking a rally that had pushed the index to record highs on the back of Germany's fiscal pivot toward defence, infrastructure and climate spending. The pullback raises

US Dollar Consolidates Ahead of FOMC Minutes Release
The US dollar has entered a period of consolidation following last week's sharp price swings, as market participants turn their attention to the release of the Federal Reserve's latest meeting minutes. Investors are looking for additional guidance on the future

EUR/USD Analysis: Who Is in Control?
Two central banks, two hawkish tones — but only one dollar just took a hit. The ECB delivered a 25bp hike in June, its first since 2023, lifting the deposit rate to 2.25% as Middle East-driven energy costs pushed headline