


BTCUSD and XRPUSD Technical Analysis – 09th NOV, 2021
FXOpen

BTCUSD: Bullish Ascending Channel Above $65,000
Bitcoin is moving in a strong bullish ascending channel above the $65,000 handle, and the continuous demand is pushing the prices of BTCUSD higher today in the European trading session. Bitcoin has already crossed its previous all-time high of $67,700 and is now trading above it.
This bitcoin rally is a result of continuous buying pressure and demand for BTC ETFs. The current trend is expected to continue with the immediate targets of $70,000 this week.
We have seen a moving averages crossover for the 5 hourly MA signifying that in the short-term, a downward correction in the levels of bitcoin is expected.
StochRSI is indicating OVERBOUGHT levels signifying that the markets can enter into a consolidation or price recovery phase at any time. Those who are looking to buy at current market levels will have to wait for the downward correction of prices to get an attractive entry for long-term holdings.
Bitcoin is now moving above its both 100 hourly simple and exponential moving averages.
Medium to long term outlook remains bullish for BTCUSD with targets of $70,000 before the end of this month.
Bitcoin is slowly consolidating its gains without any significant drop in its levels today.
- Average true range indicates less market volatility
- Williams percent range is indicating an OVERBOUGHT level
- The price is now trading just below its pivot level of $67,989
- All the moving averages are giving a STRONG BUY signal at the current market level of $67,860
Bitcoin Rally Towards $70,000 Confirmed
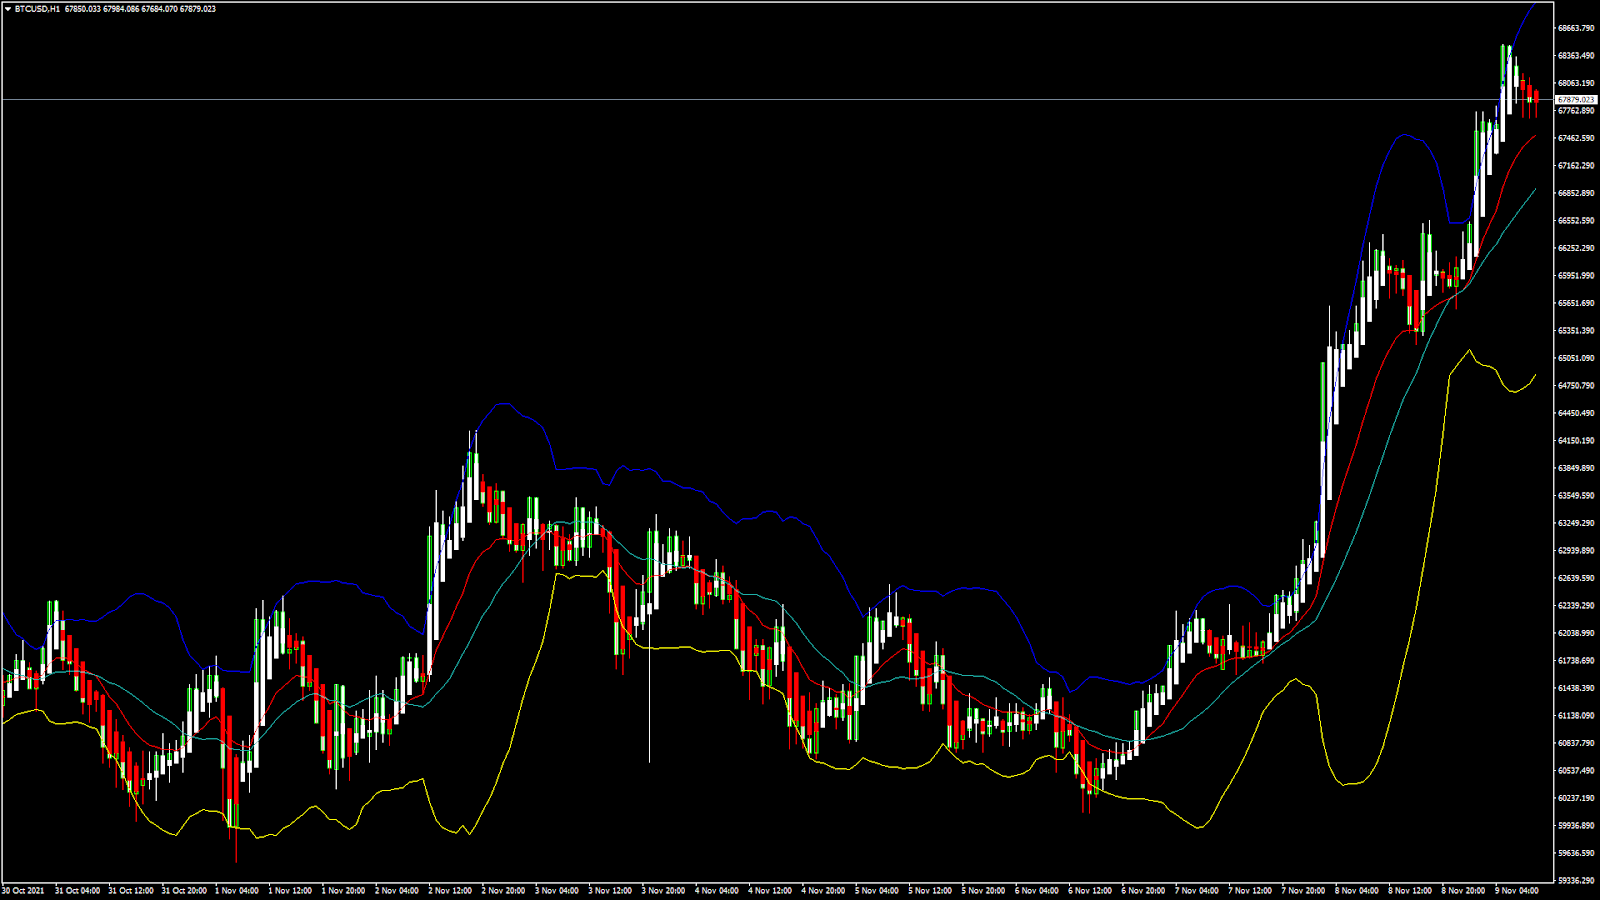
BTCUSD has already crossed its major resistance level of $64,129 and continues to trade above the important psychological support level of $65,000.
The price of BTCUSD is now facing its Fibonacci resistance level of $67,844 and Camarilla resistance level of $67,914, after which the path towards $70,000 will get cleared.
In the last 24hrs, BTCUSD has gone UP by +3.36% with the price change of +2215$ and has a 24hr trading volume of USD 40.583 billion.
Bitcoin Touches Record Highs on Inflation Fears
Since last week, Bitcoin has witnessed heavy inflow of cash investments with a total value of $95 million USD on US inflation fears. Leading investment firm JPMorgan has already revised its upwards projection for the BTC stating that bitcoin is going to cross $146,000 in the year 2022, and hit the level of $73,000 before the end of 2021.
Next week, bitcoin is also expected to roll out its biggest software update known as Taproot, which will enable increased transaction efficiency and privacy for its users.
Since last week, this news has led to an increase in the total market capitalization of bitcoin by $120 billion USD.
The Week Ahead
If the price of bitcoin continues to hold above the $65,000 handle, we can witness another rally in the markets next week which will eventually push the prices of BTCUSD towards $70,000.
A short-term correction is also expected, pushing the BTCUSD down below the $65,000 mark and also giving more opportunities to fresh buyers in the market. Since the dips in bitcoin remain well supported, there is no possibility of a trend reversal, and the uptrend is expected to continue in the next week.
This week, BTCUSD is expected to cross the $68,000 line and aim for upsides of $69,000 to $69,500 the next week. Both the medium term and long term outlooks remain positive, and next week, we could witness BTC printing at above the $68,000 mark.
Technical Indicators:
Relative strength index (14-day): at 70.04 indicating a BUY
Rate of price change: at 2.835 indicating a BUY
Moving averages convergence divergence (12,26): at 990.80 indicating a BUY
Ultimate oscillator: at 66.44 indicating a BUY
XRPUSD: Double Top Pattern Above 1.2600
Ripple is currently trading above both its 100 hourly and 200 hourly simple moving averages. The price of XRPUSD has broken the resistance level of 1.2550 after which we have seen some pullback in the level above 1.2600 in the European trading session.
We can clearly see a double top pattern above the 1.2600 handle, which signifies that the prices have reached top levels and a change in trend is expected with a momentum reversal on the short-term basis.
The price of XRP touched a high of 1.29557 yesterday, after which we can see a range bound movement between 1.29500 and 1.2500.
The upswing pattern from last week seems to have been exhausted and is a good selling opportunity at the current market level of 1.2600.
Today, the price action in XRP is in the narrow range, and this consolidation is expected to continue before any fresh downwards movements.
Ripple is trading above its pivot level of 1.25474 and is now facing its classic support level of 1.2400, after which the path towards $1.2000 handle will get cleared.
- All technical indicators are giving a STRONG SELL signal
- Moving averages 10-days crossover detected a bearish trend formation signals
- Relative strength index is NEUTRAL
- Average true range indicates less market volatility
Ripple Trend Reversal Below 1.2600 Confirmed
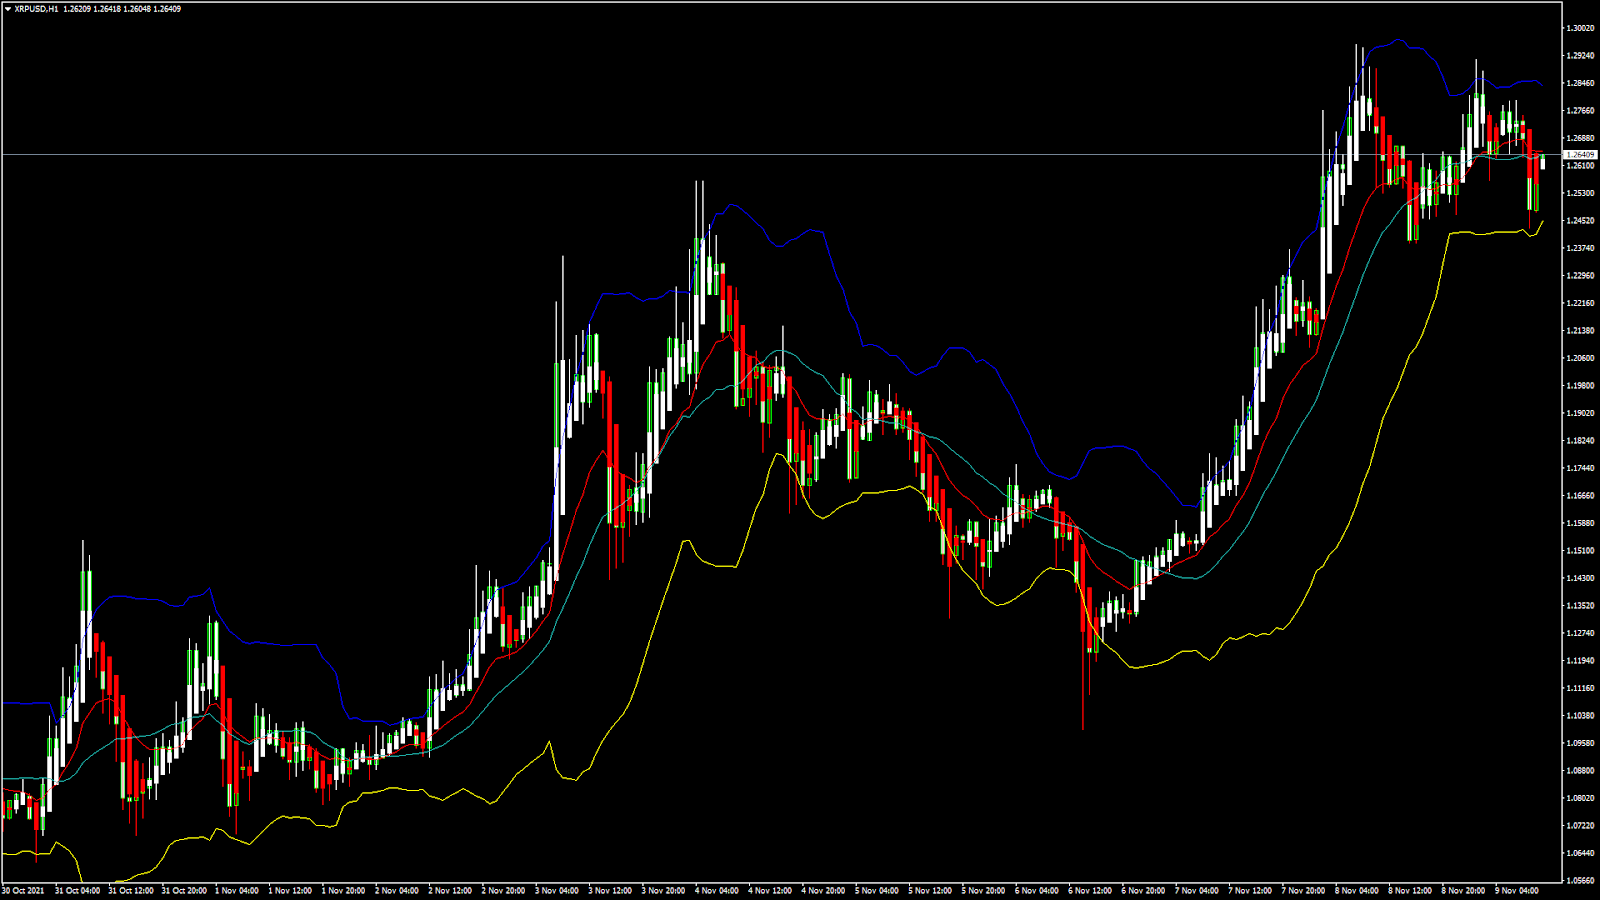
The price of Ripple is struggling to maintain its bullish momentum against the US dollar today. The upsides remain capped at 1.2700, and we can see the start of a bearish trend line formation which can push the prices of XRPUSD lower in the US trading session.
This week, we can see XRPUSD touching levels of 1.2200 and remaining in the bearish trend for the week. The immediate target for XRPUSD is 1.2300 if it is able to break its Fibonacci support level of 1.2303. We have already seen that the bullish channel seems to be over now, and the prices are now ranging in a consolidation phase.
The price of XRPUSD has gone down DOWN by -0.37% with a price change of -$0.004675 in the past 24hrs and has a trading volume of 4.771 billion USD.
This Week Ahead
In the coming days, we could witness some more short selling in XRP that will push it below the $1.2200 handle, which will open further downsides towards 1.1800.
A low market volatility suggests that the prices are in a consolidation phase, after which we could see a downwards move in the coming week.
All the major technical Indicators are giving a STRONG SELL signal, so it would be best to enter the markets at the current level.
Technical Indicators:
Commodity channel index (14-day): at -90.63 indicating a SELL
Rate of price change: at -0.030 indicating a SELL
Average directional change (14-day): at 21.37 indicating a SELL
Williams percent range: at -60.55 indicating a SELL
FXOpen offers the world's most popular cryptocurrency CFDs*, including Bitcoin and Ethereum. Floating spreads, 1:2 leverage — at your service (additional fees may apply). Open your trading account now or learn more about crypto CFD trading with FXOpen.
*Important: At FXOpen UK, Cryptocurrency trading via CFDs is only available to our Professional clients. They are not available for trading by Retail clients. To find out more information about how this may affect you, please get in touch with our team.
This article represents the opinion of the Companies operating under the FXOpen brand only. It is not to be construed as an offer, solicitation, or recommendation with respect to products and services provided by the Companies operating under the FXOpen brand, nor is it to be considered financial advice.
Stay ahead of the market!
Subscribe now to our mailing list and receive the latest market news and insights delivered directly to your inbox.


Latest articles

NZD/CHF Analysis: Which Currency Breaks the Consolidation First?
NZD/CHF remains locked in a tight range as traders await the next monetary policy catalyst.
The Reserve Bank of New Zealand heads into Wednesday's meeting on shaky ground. After May's 3-3 split was resolved by a casting vote, the

S&P 500: Index Narrows Its Range as the Labour Market Cools
The broad US market index, the S&P 500, has entered July against a backdrop of mixed signals from the labour market. The Bureau of Labor Statistics report released on 2 July showed that just 57,000 jobs were

Ethereum: Has the Recovery Begun?
Ethereum has staged a notable rebound after once again testing the heavily watched psychological zone around 1500$. Since bouncing off this support, ETH/USD has climbed roughly 13%, now trading around the $1,700 mark.
This recovery is being driven