


BTCUSD and XRPUSD Technical Analysis – 02nd NOV, 2021
FXOpen

BTCUSD: Bullish Ascending Channel Above $60,000
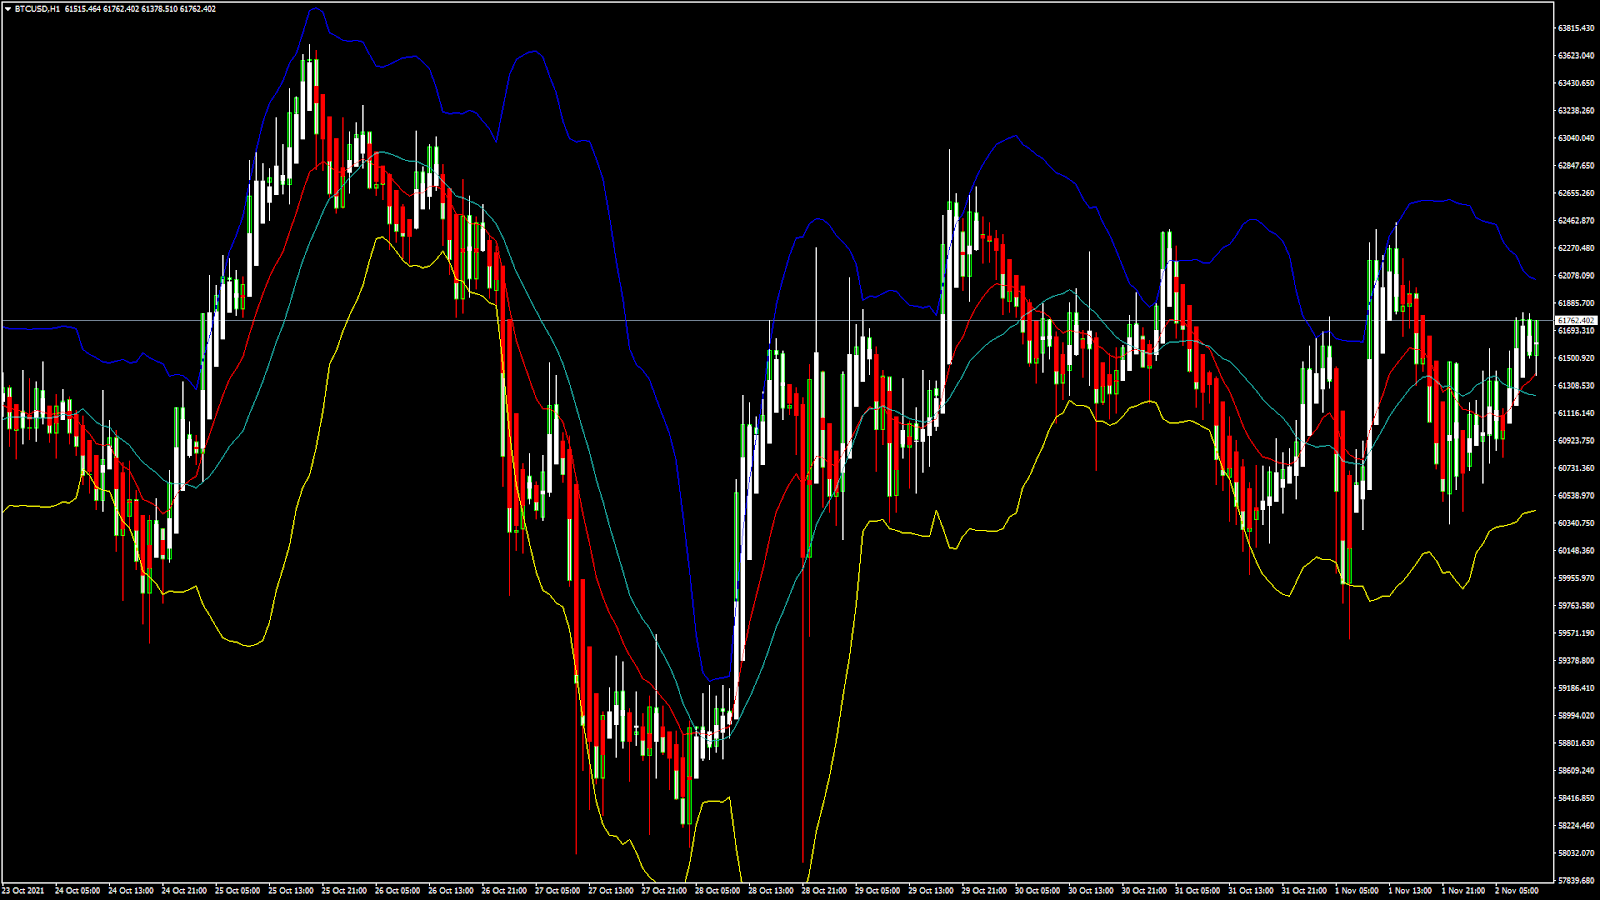
Bitcoin continues to trade steadily above $60,000 in the European trading session today. Yesterday, we saw the price of BTCUSD plummet below $60,000 but soon with renewed buying pressure it touched an intraday high of $62,443.
The price of bitcoin is now in the consolidation phase after recovering from its losses last week which saw the prices touching a low of $58,212. This short-term bearish correction is a stepping stone towards its next leg of bull run towards $65,000.
Bitcoin is now moving above its both 100 hourly simple and exponential moving averages. Relative strength index appears to be neutral signifying sideways movements for the time being.
Medium to long term outlook remains bullish for BTCUSD with targets of $70,000 before the end of this month.
Bitcoin is slowly pulling back from the selloff that was seen last week, and is in the process of creating a bullish ascending channel this week.
- Bitcoin recovered from its losses last week and is now trading above its pivot level of $61,632
- Williams percent range is indicating OVERBOUGHT level
- The price is now trading above its classic support level of $61,200
- All the moving averages are giving a STRONG BUY signal at the current market level of $61,563
Bitcoin: Recovery From Weekend Losses, March Towards $61,500
BTCUSD has gone down by 8% from its all-time high price of $66,987, and we saw that this price action was achieved after sub-bearish moves below $60,000. This is an indication of a fresh upwards move in bitcoin which can break its all-time high level soon.
The price of BTCUSD is now facing its Camarilla resistance level of $61,569 and Fibonacci resistance level of $61,891, after which the path towards $63,000 will get cleared.
In the last 24hrs BTCUSD has gone DOWN by -0.26% with the price change of +104$, and has a 24hr trading volume of USD 34.007 billion.
Bitcoin Volatility Index
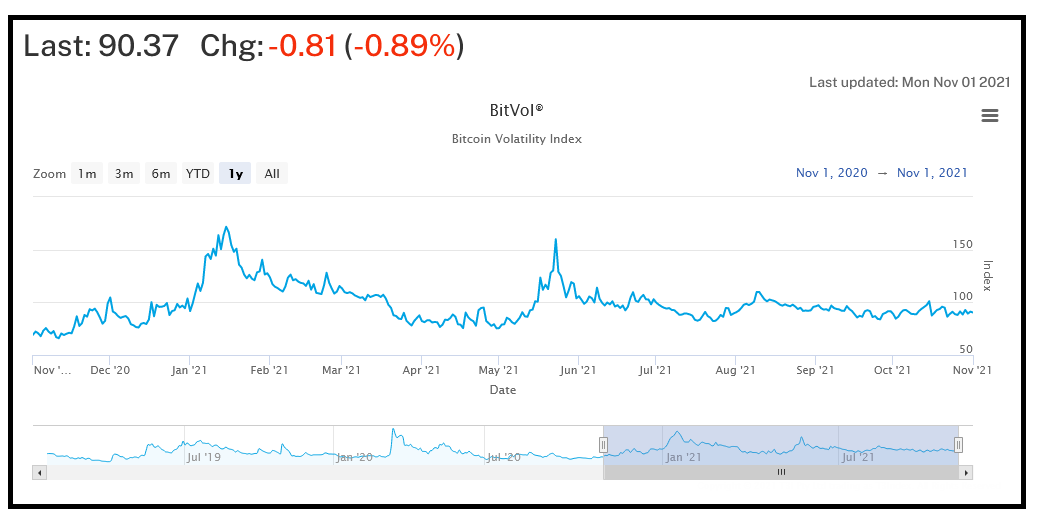
The volatility index of bitcoin shows the constant range of 85 to 95 in the preceding 3 months. This also has a significance since the value of holdings in bitcoin for the investors needs to remain stable.
With the introduction of the bitcoin ETFs, we should expect stable price movement, continued appreciation in the form of attracting more cash investments, and increased total market capitalization.
At present, the TMC of bitcoin is at $1,160 billion USD.
The Week Ahead
The price of BTCUSD is holding above the important psychological level of $60,000 and a positive momentum is seen in the short term range. It is crucial for the price to hold above the $60,000 handle for the next bitcoin rally towards $63,000.
This week, BTCUSD is expected to cross $64,000, and aim for upsides of $66,000 to $68,500 the next week. Both the medium term and long term outlooks remain positive. Next week, we could witness BTC printing above the $65,000 mark.
Technical Indicators:
Bull/Bear power (13-day): at 183.82 indicating a BUY
Commodity channel index (14-day): at 96.86 indicating a BUY
Moving averages convergence divergence (12,26): at 140.50 indicating a BUY
Ultimate oscillator: at 56.51 indicating a BUY
XRPUSD: Resistance Channel Broken Above 1.0900
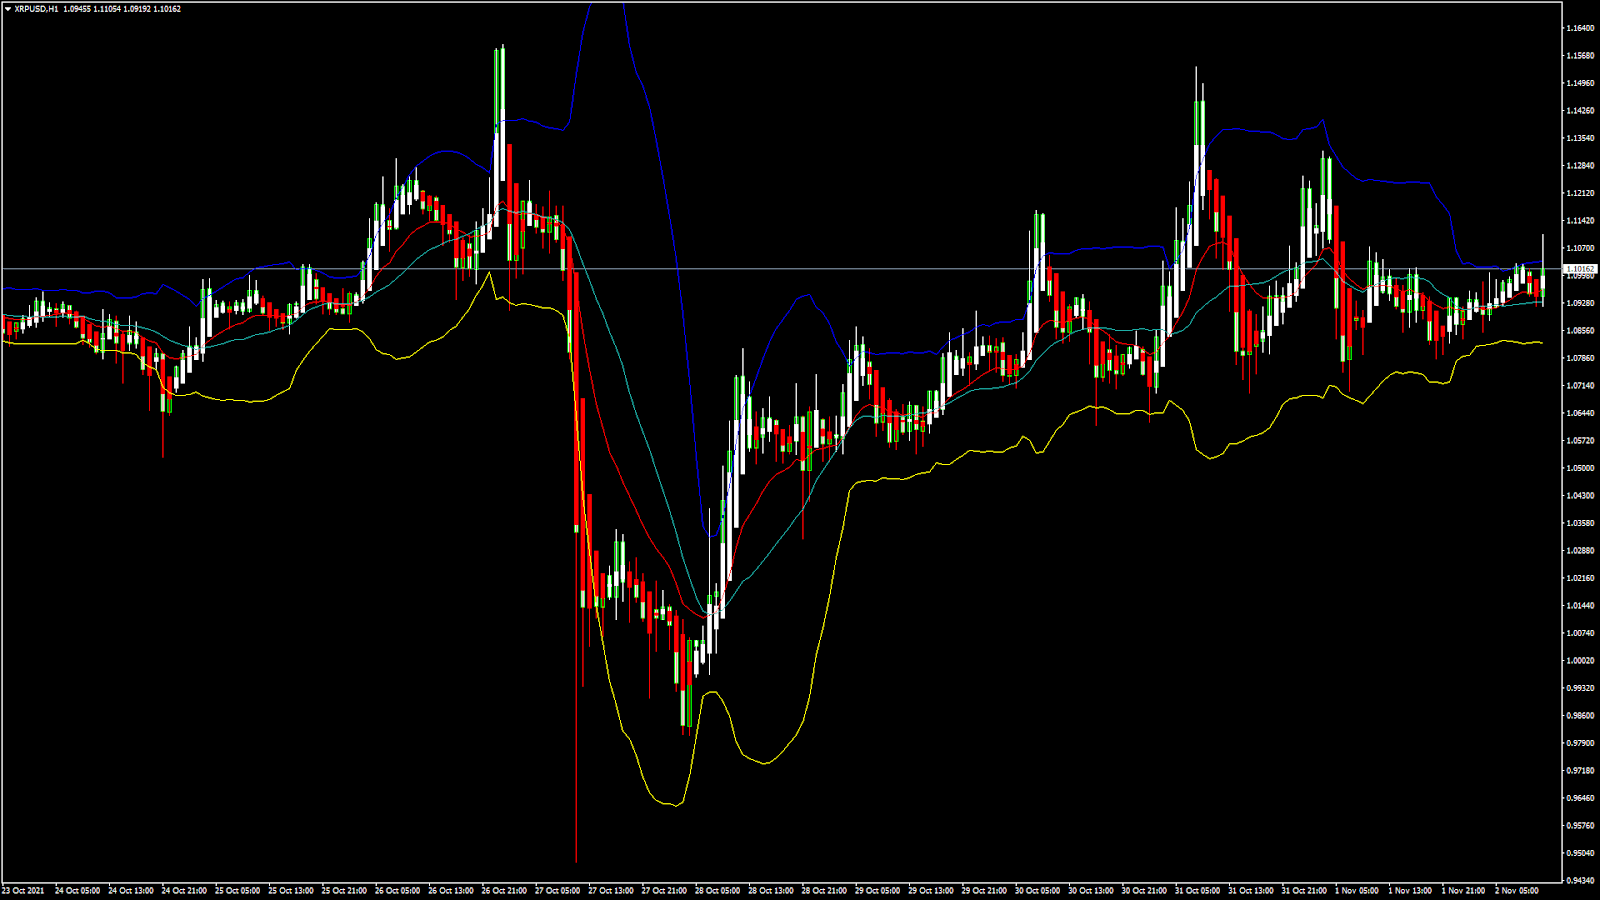
Ripple is currently trading above both its 100 hourly and 200 hourly simple moving averages. The price of XRPUSD has broken the resistance channel above 1.0900 and is now preparing for its next rally towards the $1.2000 handle this week.
Last Sunday, we saw Ripple touching a high of 1.15371 and a low of 1.06363, after which the prices have continued to range above the 1.07 handle. Yesterday, we also saw an upwards trend line which touched an intraday high of 1.13021 after which bearish correction took place taking the prices down to 1.07001.
Today, the price action in the XRP is in the narrow range and this consolidation is expected to continue before any fresh upwards movements.
Ripple has just broken its pivot level of 1.0942 and is now facing its classic resistance level of 1.09974 after which the path towards $1.2000 handle will get cleared.
- The price remains above 200 hourly simple and exponential moving average.
- Moving averages 10-day crossover detected, signaling a Bullish Trend
- Relative strength index is NEUTRAL
- Average true range indicates less market volatility
Ripple Consolidating Towards 1.1000
Ripple will need to remain above the $1.0800 handle for the next bullish run expected this week. We have already seen that the bearish channel has failed and the prices are now ranging in a consolidation phase.
The price of XRPUSD has gone UP by +0.23% with a price change of -$0.003474 in the past 24hrs and has a trading volume of 3.234 Billion USD.
The Week Ahead
We could witness some more short selling in XRP pushing it below the $1.0800 handle, after which a bullish wave of correction will get started and the prices will reach above $1.2000 handle in the coming days.
Low market volatility suggests that the prices are in a sub consolidation phase, after which we could see an upwards move this week.
Technical indicators are giving a MIXED signal so it would be better to wait for some more price correction before entering into the markets.
Technical Indicators:
Average direction change (14-day): at 18.29 indicating NEUTRAL
Ultimate oscillator: at 53.33 indicating a BUY
Stoch RSI (9,6): at 66.11 indicating a BUY
Williams percent range: at -44.94 indicating a BUY
FXOpen offers the world's most popular cryptocurrency CFDs*, including Bitcoin and Ethereum. Floating spreads, 1:2 leverage — at your service (additional fees may apply). Open your trading account now or learn more about crypto CFD trading with FXOpen.
*Important: At FXOpen UK, Cryptocurrency trading via CFDs is only available to our Professional clients. They are not available for trading by Retail clients. To find out more information about how this may affect you, please get in touch with our team.
This article represents the opinion of the Companies operating under the FXOpen brand only. It is not to be construed as an offer, solicitation, or recommendation with respect to products and services provided by the Companies operating under the FXOpen brand, nor is it to be considered financial advice.
Stay ahead of the market!
Subscribe now to our mailing list and receive the latest market news and insights delivered directly to your inbox.


Latest articles

NZD/CHF Analysis: Which Currency Breaks the Consolidation First?
NZD/CHF remains locked in a tight range as traders await the next monetary policy catalyst.
The Reserve Bank of New Zealand heads into Wednesday's meeting on shaky ground. After May's 3-3 split was resolved by a casting vote, the

S&P 500: Index Narrows Its Range as the Labour Market Cools
The broad US market index, the S&P 500, has entered July against a backdrop of mixed signals from the labour market. The Bureau of Labor Statistics report released on 2 July showed that just 57,000 jobs were

Ethereum: Has the Recovery Begun?
Ethereum has staged a notable rebound after once again testing the heavily watched psychological zone around 1500$. Since bouncing off this support, ETH/USD has climbed roughly 13%, now trading around the $1,700 mark.
This recovery is being driven