


FXOpen
BTC/USD
On yesterday’s open the price of Bitcoin was sitting around $8985 as the price came down to the descending trendline after an interaction was made with the 0.382 Fibonacci level on Sunday. From there the price made another attempt to surpass the Fibonacci level but the interaction again ended as a rejection causing the price to pull back to $9058 at its lowest point today and is currently being traded at $9134. 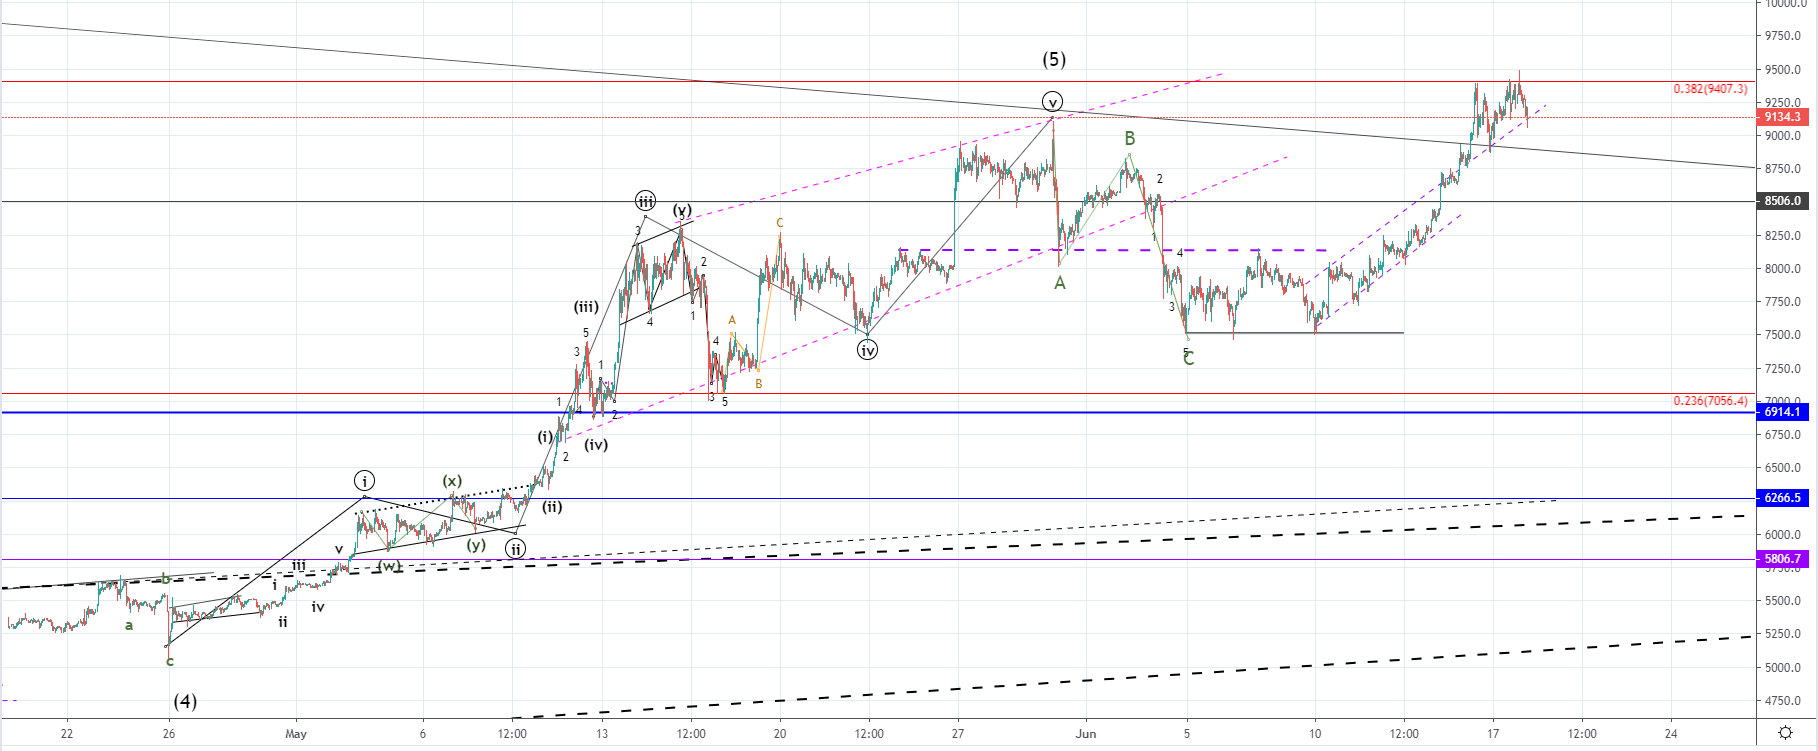 On the hourly chart, you can see that the price has increased from last Monday and managed to go above two significant horizontal resistance levels – first being at $8140 and the second around $8500, which indicated strong bullish momentum. As the price increased parabolically the next and the most significant horizontal Fibonacci level was reached and has been interacted with for two times with the interactions ending as rejection the price hasn’t managed to break out to the upside.
This could mean that the bullish momentum caught from last Monday isn’t strong enough to surpass the mentioned significant resistance at around $9400, so we could see a steeper pullback before another attempt. If we see a pullback the price would likely find lookout for support around the broken resistance point on the way up, so a retest of the $8500 would look likely. But if we saw the end of the bullish rise altogether, the price would continue moving further to the downside.
As the five-wave impulse to the upside from 26th of April likely ended on 30th of May the price action movement we are now seeing is viewed as corrective in nature with the increase was seen from last Monday being its second wave. This means that now the third wave to the downside should start shortly as a retest of the most significant resistance occurred, but if the price continues moving above the 0.382 Fibonacci level it could mean that the five-wave increase previously seen hasn’t marked the end of the higher degree 5th wave of the Minor count and that another impulse wave to the upside is developing.
XRP/USD
From yesterday’s low at $0.4277 the price of Ripple increased by around 6.83% coming to $0.4568 at its highest point today, but since today’s high the price started moving to the downside and fell to $0.433 at its lowest spike.
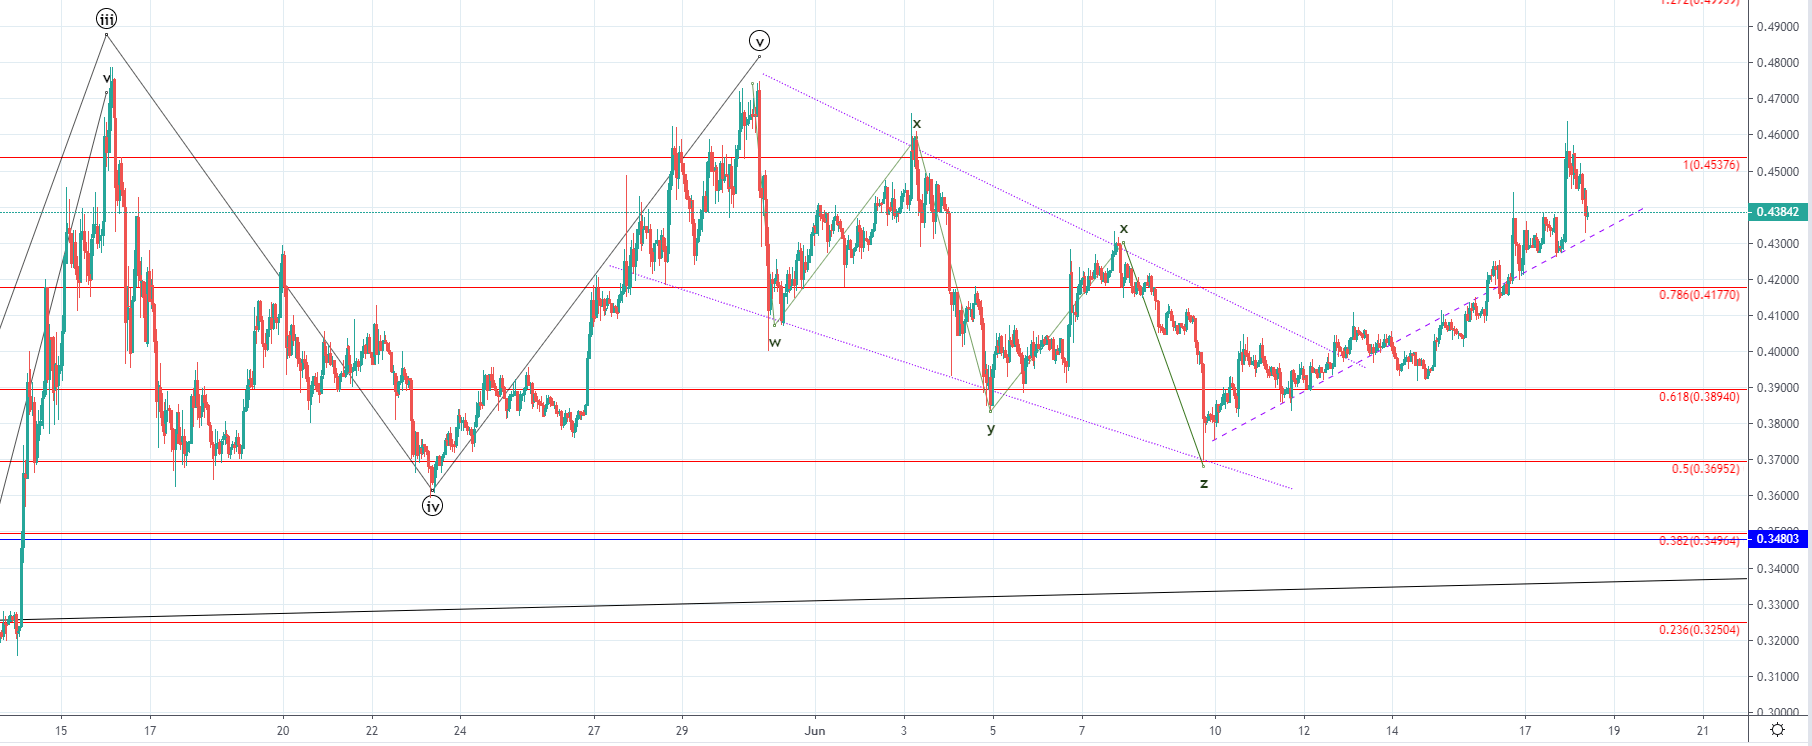
Looking at the hourly chart, you can see that the price made an interaction with the 1 Fibonacci level which was the significant horizontal resistance point on the previous two increases which the price slightly surpassed but immediately after decreased impulsively, going back below it to the 0.5 Fibonacci level at $0.36952. The price was increasing from last Monday, the 10th of June, until today when the interaction has been made with the mentioned significant horizontal resistance. Since an increase of 19.86% has been made and the price failed to break out to the upside, we are now likely going to see it pulling back to some of the significant support levels out of which the first one would be at the 0.786 Fib level which is in price terms at $0.4177.
But if the increase seen from last Monday was the second wave out of the starting downtrend of a higher degree, the price would continue moving further to the downside below the 0.5 Fibonacci level.
FXOpen offers the world's most popular cryptocurrency CFDs*, including Bitcoin and Ethereum. Floating spreads, 1:2 leverage — at your service. Open your trading account now or learn more about crypto CFD trading with FXOpen.
*At FXOpen UK and FXOpen AU, Cryptocurrency CFDs are only available for trading by those clients categorised as Professional clients under FCA Rules and Professional clients under ASIC Rules respectively. They are not available for trading by Retail clients.
This article represents the opinion of the Companies operating under the FXOpen brand only. It is not to be construed as an offer, solicitation, or recommendation with respect to products and services provided by the Companies operating under the FXOpen brand, nor is it to be considered financial advice.
Latest from Cryptocurrencies
Latest articles

Since the Start of the Week, Brent Oil Price Has Dropped over 4%
At the beginning of the week, March 15, we wrote that the price of Brent oil could form a correction from the resistance level of USD 91 per barrel. Since then, the price has decreased by more than 4% due

Fair Value Gaps vs Liquidity Voids in Trading
Understanding fair value gaps and liquidity voids is essential for traders seeking to navigate the complexities of the financial markets. These concepts, deeply rooted in the Smart Money Concept (SMC), provide valuable insights into the dynamics of supply and demand,
UK100 Share Index Rises as UK Inflation Slows
Yesterday, the UK Office for National Statistics (ONS) reported that the CPI stood at 3.2% in March. According to ForexFactory, analysts expected 3.1%, and a month ago the index was 3.4%.
Grant Fitzner, chief economist at the