


FXOpen

BTC/USD
Last Monday the price of Bitcoin was $10503 and spiked further to $10675 at its highest point. From there the price has decreased by 10.41% as it came down to its lowest point at $9417.9 on Thursday. As the price came down to its significant horizontal support level last Thursday and found support there a recovery has been seen of around 11% as it came up to the same levels as on last Monday.
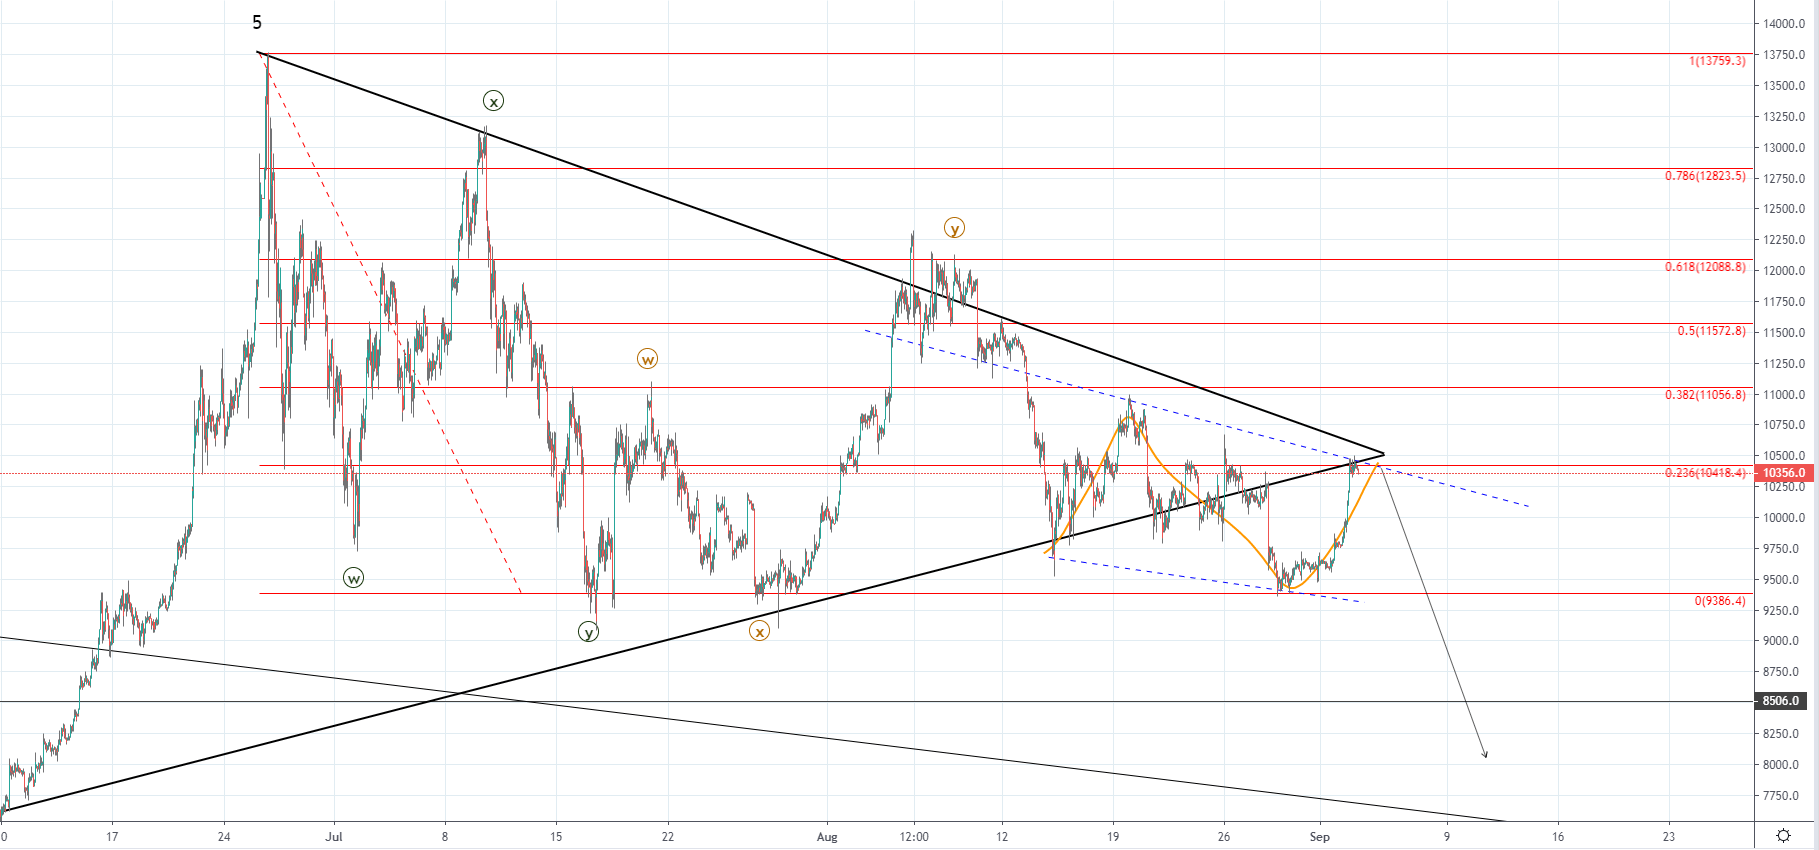 As you can see from the hourly chart, the price has started to break out to the downside from the symmetrical triangle which was formed since the 26th of June but it found support on the previous low levels at 0 Fibonacci line which has caused a bounce to the 0.236 Fib level and is currently retesting the broken triangle’s support.
If the price gets rejected at the current levels it could be interpreted as a retest of the broken support which is set to cause another downfall with the price most likely going below the 0 Fib level which served as support potentially to around the $8500 area which serves as a the lower horizontal support level but if the breakout momentum increases it will likely not hold. As we’ve seen two WXY corrections the current structure is likely the third one which could either be a five-wave move or another three-wave correction but in either way from here I would be expecting further downside from here.
XRP/USD
The price of Ripple was $0.27788 at its highest point on Monday from where we’ve seen a decrease of 10.34% at its lowest point to $0.249 made on Thursday but as the price came down to its lower horizontal support level and found support there a minor recovery has been seen of around 6% as the price came up to $0.2645.
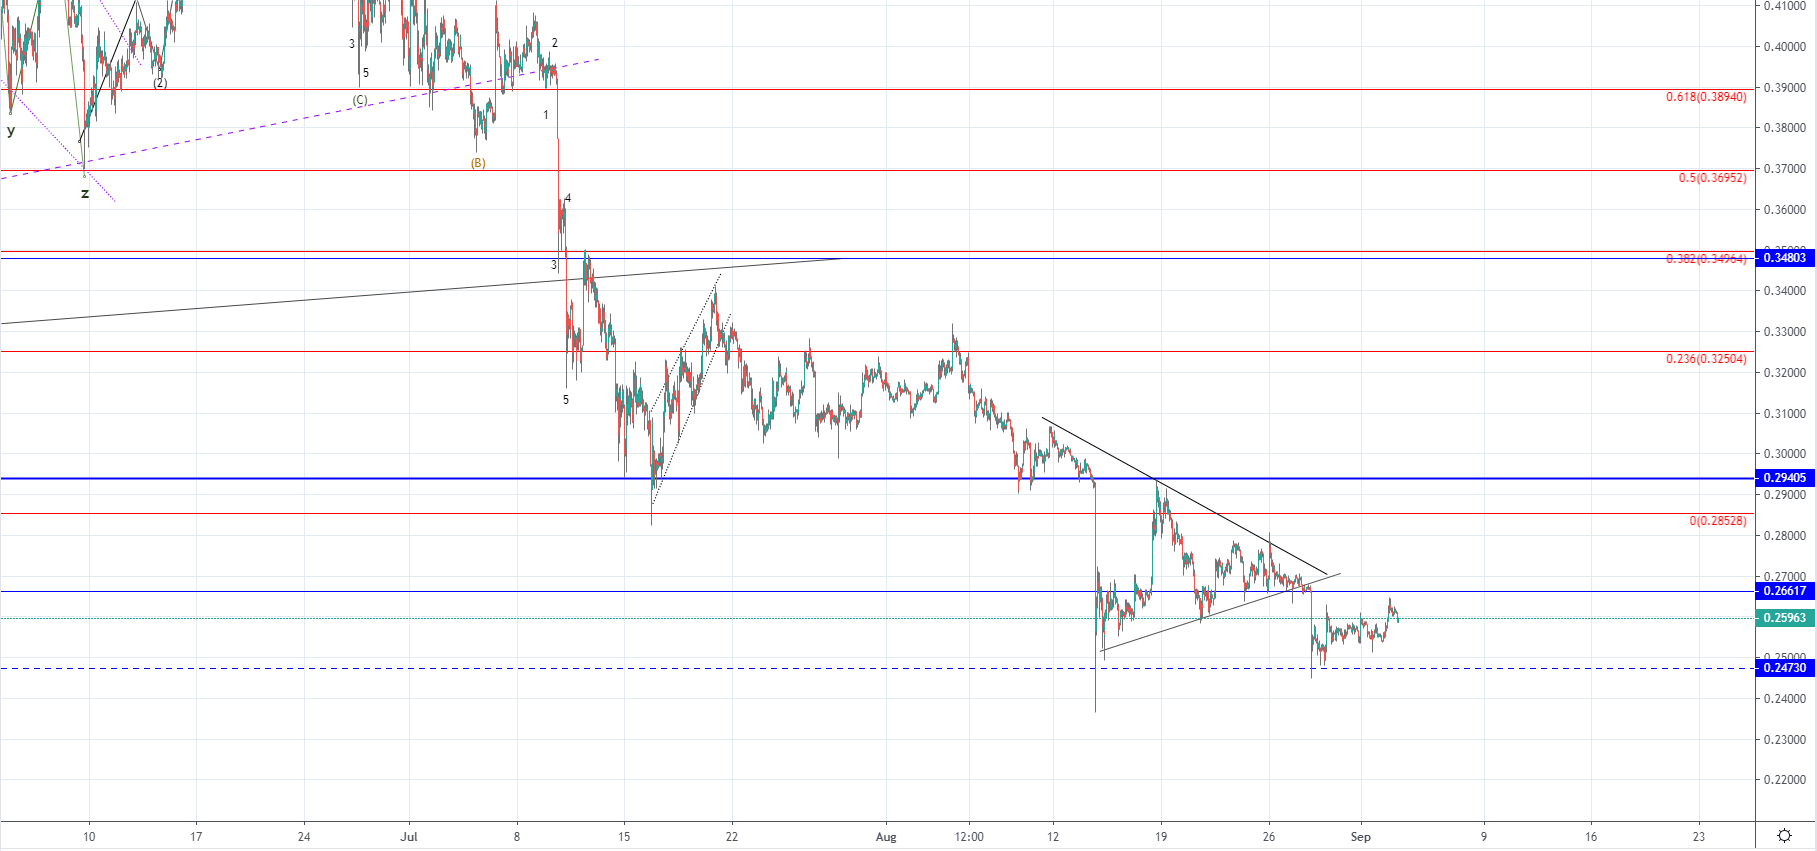 Looking at the hourly chart, you can see that similarly like in the case of Bitcoin the price of Ripple has broken out off of the symmetrical triangle and started moving to the downside but made a recovery to its broken horizontal level for a retest. Unlike in the case of Bitcoin, the recovery seen is a minor one which could mean that the recovery would continue but as the price reached the vicinity of the upper horizontal support which now serves as resistance we could see a rejection.
If the price gets rejected at the upper horizontal level at $0.26617 we could see further downside for the price of Ripple but if the price manages to move above it and stays there we could see the recovery continuing to the most significant one at $0.29405.
FXOpen offers the world's most popular cryptocurrency CFDs*, including Bitcoin and Ethereum. Floating spreads, 1:2 leverage — at your service. Open your trading account now or learn more about crypto CFD trading with FXOpen.
*At FXOpen UK and FXOpen AU, Cryptocurrency CFDs are only available for trading by those clients categorised as Professional clients under FCA Rules and Professional clients under ASIC Rules respectively. They are not available for trading by Retail clients.
This article represents the opinion of the Companies operating under the FXOpen brand only. It is not to be construed as an offer, solicitation, or recommendation with respect to products and services provided by the Companies operating under the FXOpen brand, nor is it to be considered financial advice.
Latest from Cryptocurrencies
Latest articles

Weekly Market Wrap With Gary Thomson: UK100, USD, GOLD, OIL
Get the latest scoop on the week's hottest headlines, all in one convenient video. Join Gary Thomson, the COO of FXOpen UK, as he breaks down the most significant news reports and shares his expert insights.
- UK100 Share Index Rises

What Is a Darvas Box Theory and How Does It Work in Trading?
The Darvas Box Theory, pioneered by Nicolas Darvas in the 1950s, has transcended its stock market origins to become a valuable tool for forex traders. This method leverages specific price movements and patterns, known as the Darvas Box, to track

NFLX Stock Price Falls Despite Subscriber Growth
Yesterday, after the close of the main trading session on the stock market, Netflix reported to investors for the 1st quarter of 2024.
The report turned out better than expected:
→ earnings per share: actual = USD 5.28, forecast = USD 4.