


FXOpen
BTC/USD
From last week’s analysis, when the price of Bitcoin was $3925, we have seen stagnation as the price was hovering sideways around those level until yesterday, when another decrease of 3.12% was made from $3906 to $3784.
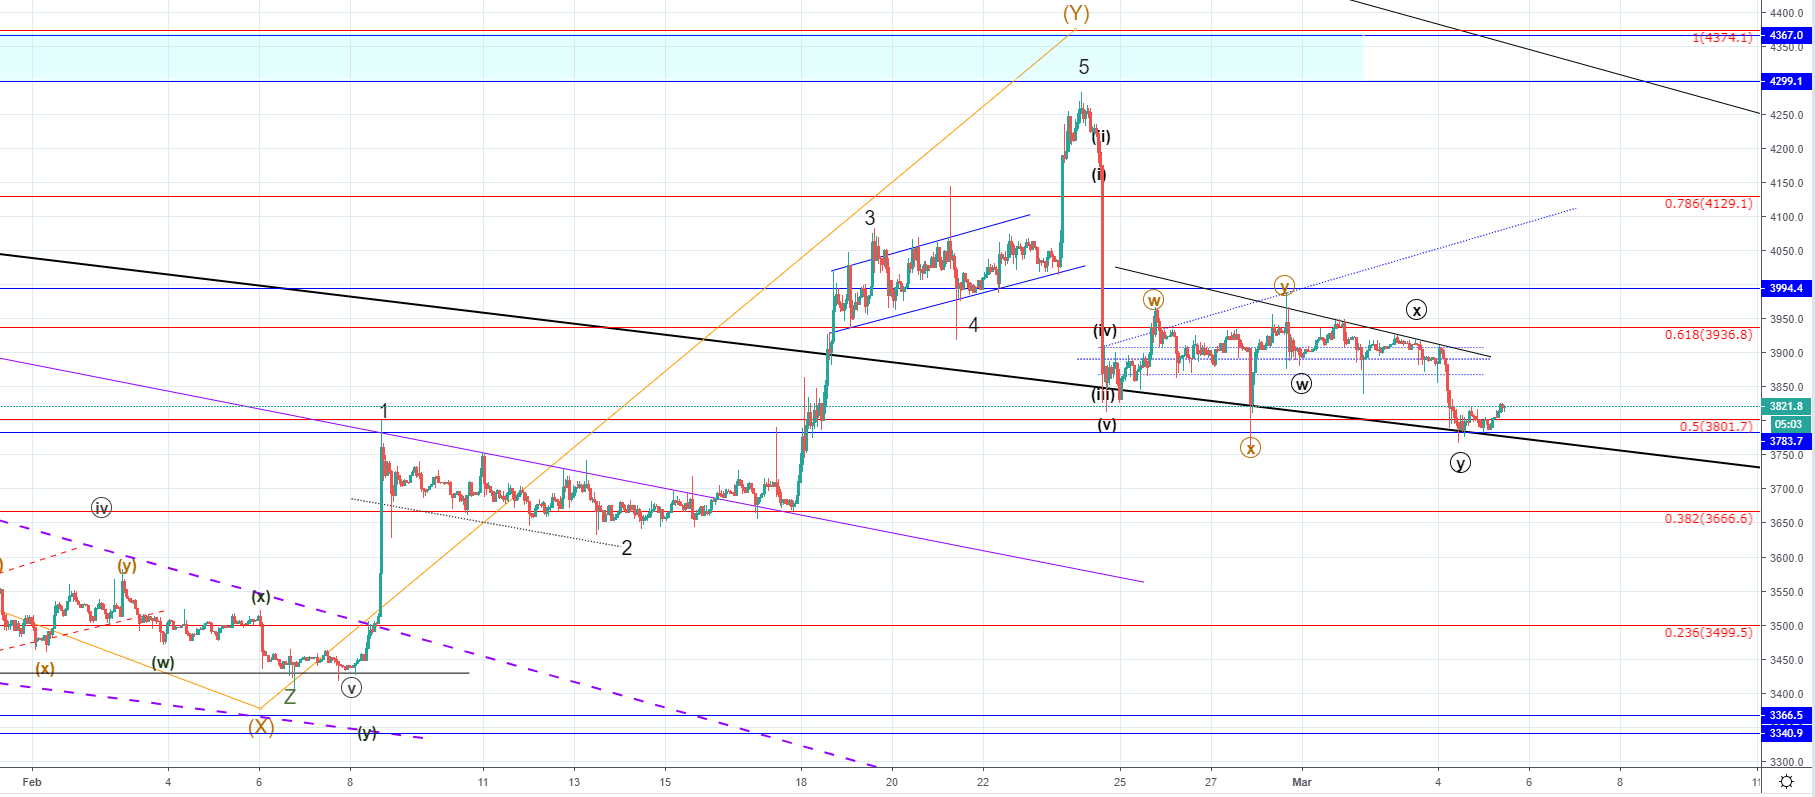
Looking at the hourly chart, we can see that yesterday’s decrease was a breakout from the horizontal range in which the price moved sideways, consolidating after the initial drop of over 10%. The price fell to the most significant support level which is the baseline support since the start of the bear market and has found support there as it retested the level twice before going in an upward trajectory again.
Now, when the price is above the 0.5 Fibonacci level and the baseline support, we are most likely to see further upside movement, but according to my count, it would be the final Minute correction to the upside before the price starts moving down again for a breakout to the downside. This is expected due to the fact that previous to the formation of the horizontal range we have seen an impulsive move to the downside, which is most likely to continue after the period of consolidation ends as the Intermediate Y wave ended and we are most likely seeing an impulsive move to the downside as a trend continuation.
XRP/USD
The price of Ripple has decreased by 4.84% over the course of the last seven days as it came down from $0.33561 on Tuesday to the current level at $0.31885.
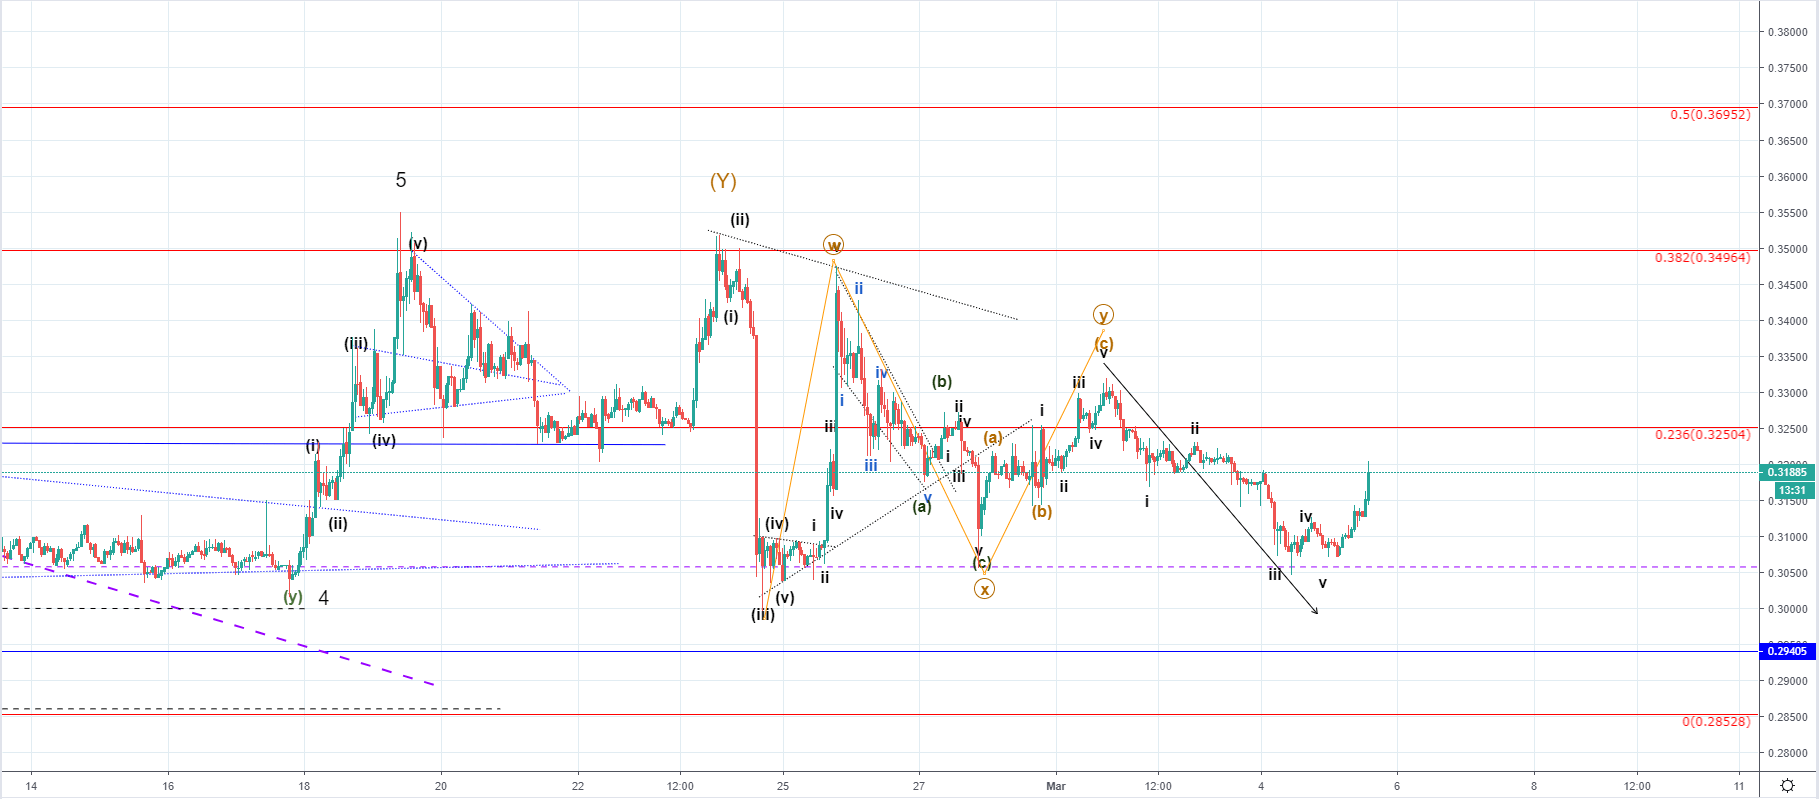
On the hourly chart, we can see that the price of Ripple is once again in an upward trajectory as it came down to its horizontal support on a 5-wave move. Like in the case of Bitcoin I believe that this upside movement is correctional as previously the price of Ripple broke below the 0.236 Fibonacci level, which served as support, and we could see now the price back to its vicinity for a retest of resistance.
Wave structure implies that the current increase is impulsive, so the previous 5-wave move wasn’t the beginning of the next impulse wave to the downside and is most likely the correction inside the Minute WXY and the current increase could be the Y wave as the previous movement to the downside could be the wave X. If this is true, then we could see the price of Ripple go above the 0.236 Fibonacci level before further downside, although now very likely.
FXOpen offers the world's most popular cryptocurrency CFDs*, including Bitcoin and Ethereum. Floating spreads, 1:2 leverage — at your service. Open your trading account now or learn more about crypto CFD trading with FXOpen.
*At FXOpen UK and FXOpen AU, Cryptocurrency CFDs are only available for trading by those clients categorised as Professional clients under FCA Rules and Professional clients under ASIC Rules respectively. They are not available for trading by Retail clients.
This article represents the opinion of the Companies operating under the FXOpen brand only. It is not to be construed as an offer, solicitation, or recommendation with respect to products and services provided by the Companies operating under the FXOpen brand, nor is it to be considered financial advice.
Latest from Cryptocurrencies
Latest articles

Weekly Market Wrap With Gary Thomson: UK100, USD, GOLD, OIL
Get the latest scoop on the week's hottest headlines, all in one convenient video. Join Gary Thomson, the COO of FXOpen UK, as he breaks down the most significant news reports and shares his expert insights.
- UK100 Share Index Rises

What Is a Darvas Box Theory and How Does It Work in Trading?
The Darvas Box Theory, pioneered by Nicolas Darvas in the 1950s, has transcended its stock market origins to become a valuable tool for forex traders. This method leverages specific price movements and patterns, known as the Darvas Box, to track

NFLX Stock Price Falls Despite Subscriber Growth
Yesterday, after the close of the main trading session on the stock market, Netflix reported to investors for the 1st quarter of 2024.
The report turned out better than expected:
→ earnings per share: actual = USD 5.28, forecast = USD 4.