


FXOpen
BTC/USD
The price of Bitcoin has fallen today to $53,548 at its lowest point from which we have seen an increase of 5.4% as a minor recovery was made to $56,388. Currently, the price is sitting at $55,893 as a pullback is being made but the price is still in an upward trajectory overall.
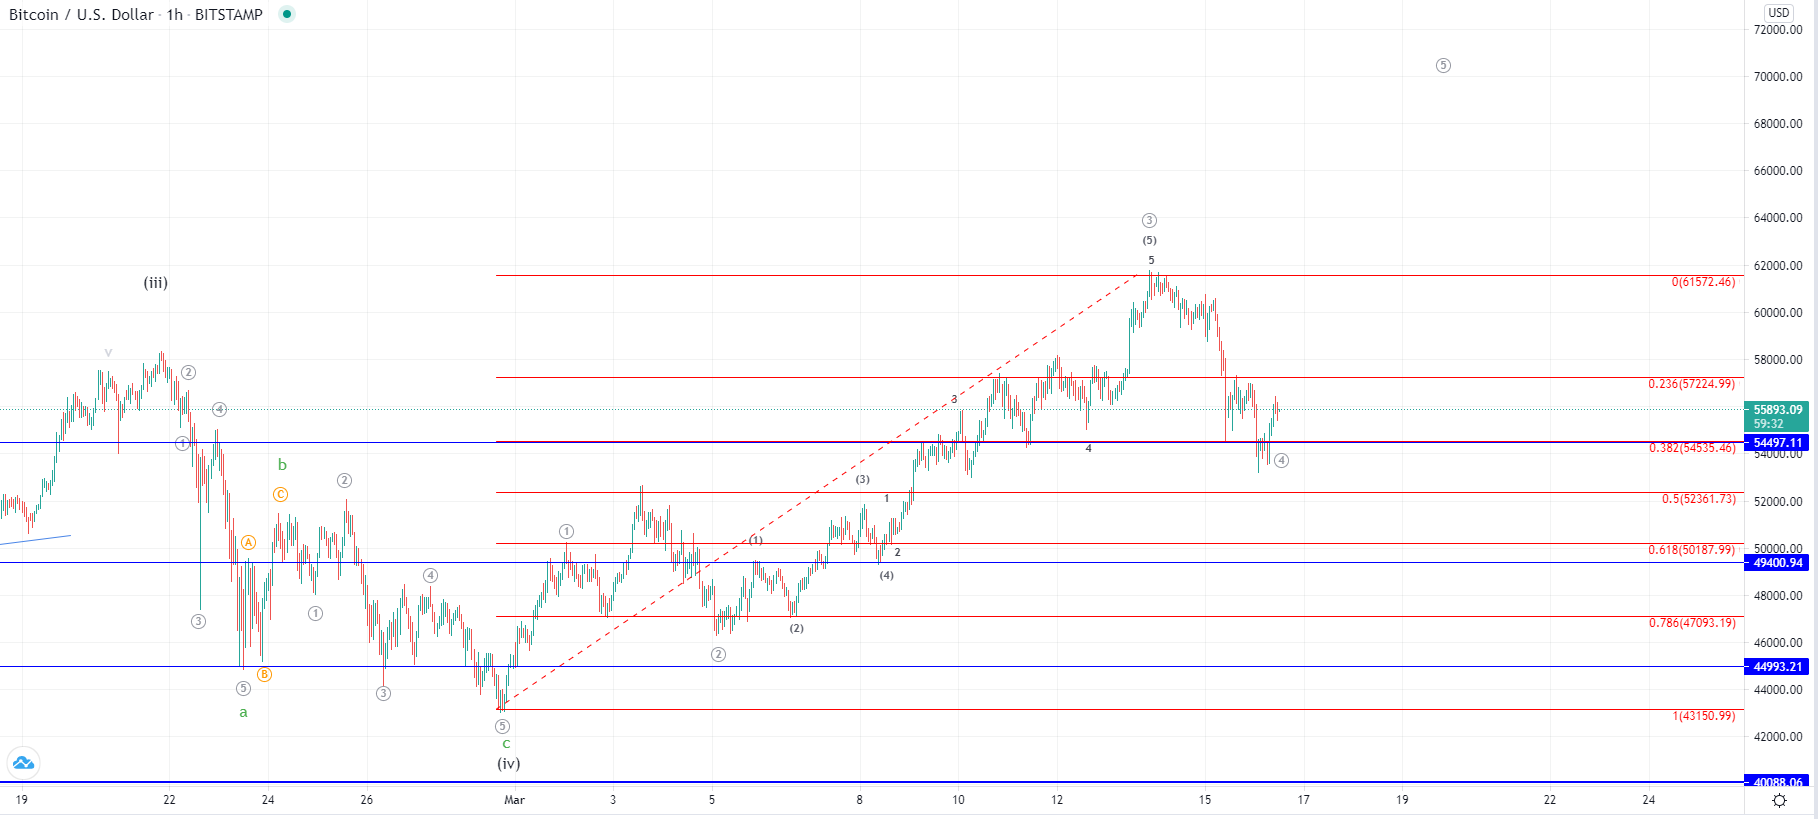
Looking at the hourly chart, you can see that the price has fallen back to the 0.382 Fibonacci level measured from the upward impulse from the start of the month to its new all-time high made on the 13th of March. This could be and most likely is the 4th wave out of the five-wave impulse to the upside from the next starting impulse wave to the upside. If that is true, then the price cannot fall inside the territory of the 1st wave which would be below the 0.5 Fib level at $52,361.
Now as we have seen a bounce off of the significant horizontal level at $54,497 it could mark the completion of this 4th wave which is why the increase seen today would be the 1st sub-wave of the next move to the upside that is set to push the price of Bitcoin above its prior all-time high an on to the new one. However, this has to be validated as the price could now be headed further down. The point of validation would be an increase above the 0.236 Fib level or the invalidation if the price continues moving below the 0.382 support.
XRP/USD
From today’s low at $0.4294, the price of Ripple has increased by 20.65% today as it came up to $0.5181 at its highest spike. Now it made a decline again and is currently sitting at $0.47363.
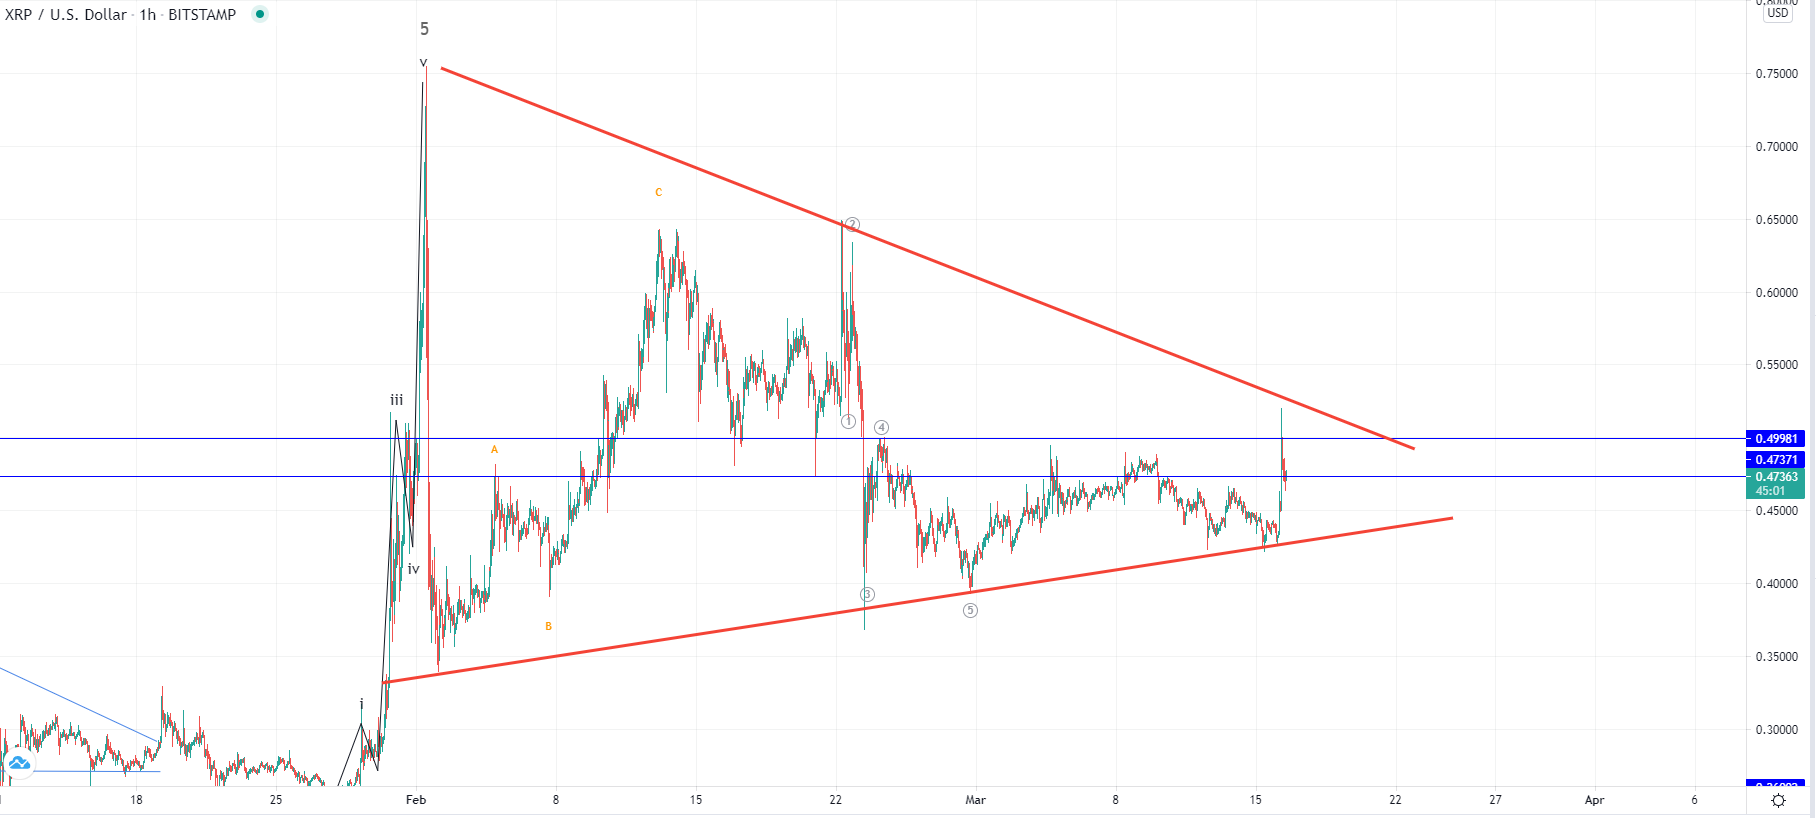
On the hourly chart, you can see that the price bounced from the ascending support level that dates from the first significant decrease in February which was the third interaction and the confirmation of the support level. This is also the case for its resistance level as today’s spike reached the descending trendline and made a third interaction which is why we can now outline the symmetrical triangle in which the price is after the highly significant increase to $0.75 level was made on the 1st of February.
This could be interpreted as a consolidative range inside which the price has been finding interest from both the seller’s and the buyer’s side. Now as it started approaching the apex of the triangle a breakout looks ahead. As this is a symmetrical triangle a breakout direction is equally possible from both sides, but since the move before the formation of the symmetrical triangle was to the upside it is slightly more likely that the breakout would be bullish.
This forecast represents FXOpen Markets Limited opinion only, it should not be construed as an offer, invitation or recommendation in respect to FXOpen Markets Limited products and services or as financial advice.
Cryptocurrency CFDs are not available to trade in all jurisdictions.
FXOpen offers the world's most popular cryptocurrency CFDs*, including Bitcoin and Ethereum. Floating spreads, 1:2 leverage — at your service. Open your trading account now or learn more about crypto CFD trading with FXOpen.
*At FXOpen UK and FXOpen AU, Cryptocurrency CFDs are only available for trading by those clients categorised as Professional clients under FCA Rules and Professional clients under ASIC Rules respectively. They are not available for trading by Retail clients.
This article represents the opinion of the Companies operating under the FXOpen brand only. It is not to be construed as an offer, solicitation, or recommendation with respect to products and services provided by the Companies operating under the FXOpen brand, nor is it to be considered financial advice.
Latest from Cryptocurrencies
Latest articles

Since the Start of the Week, Brent Oil Price Has Dropped over 4%
At the beginning of the week, March 15, we wrote that the price of Brent oil could form a correction from the resistance level of USD 91 per barrel. Since then, the price has decreased by more than 4% due

Fair Value Gaps vs Liquidity Voids in Trading
Understanding fair value gaps and liquidity voids is essential for traders seeking to navigate the complexities of the financial markets. These concepts, deeply rooted in the Smart Money Concept (SMC), provide valuable insights into the dynamics of supply and demand,
UK100 Share Index Rises as UK Inflation Slows
Yesterday, the UK Office for National Statistics (ONS) reported that the CPI stood at 3.2% in March. According to ForexFactory, analysts expected 3.1%, and a month ago the index was 3.4%.
Grant Fitzner, chief economist at the