


FXOpen
BTC/USD
The price of Bitcoin has been decreasing from yesterday’s open at $10088 and has come down by 4.46% measured to its lowest point today which was at $9638. This decrease is a continuation of the downtrend which started on the 6th of September when the price was sitting at $10920 which is a decrease of 11.94% measured to its lowest point today. Currently, the price is being traded at $9716 as a minor recovery is being made.
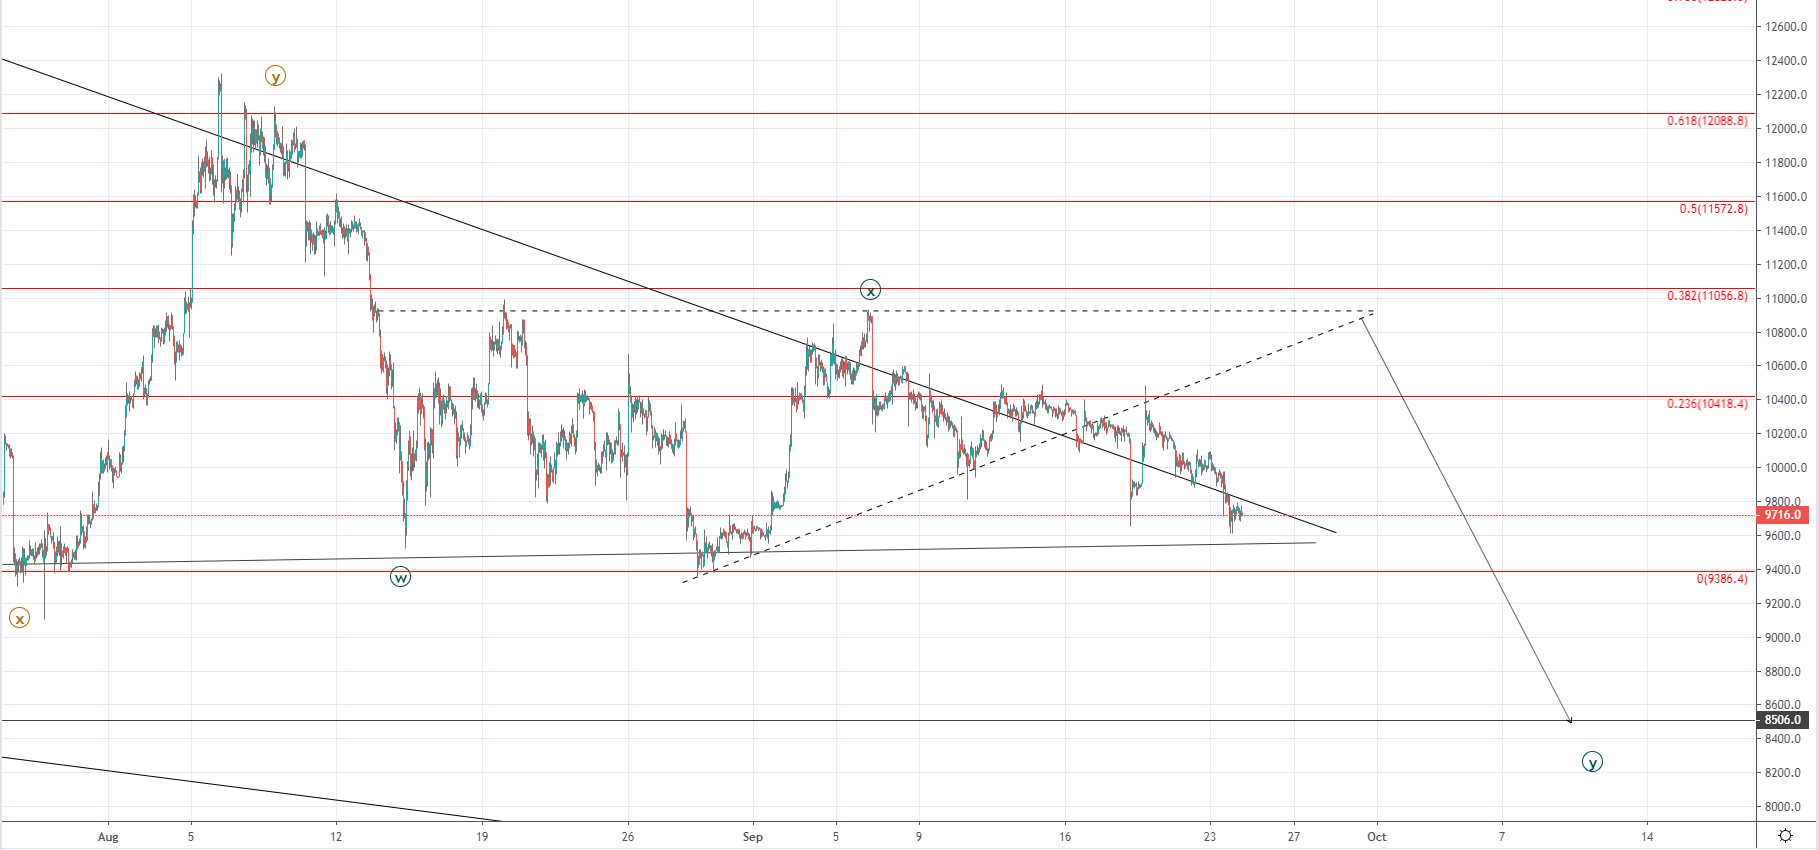 On the hourly chart, you can see that the price has almost come down to the descending triangle's support at $9386 but there wasn’t any interaction. As the price is in a downward trajectory we could expect to see an interaction with the support level after which we are to see if a bounce occurs of would we see a breakout to the downside.
As we’ve seen the completion of the second WXY correction to the upside on the 6th of August the structure which followed is most likely the 3rd one to the downside. This is why ultimately I would be expecting a downfall below the triangle’s support level, but we might see a bounce from it at first as the X wave from the 3rd WXY correction might end as a five-wave consolidation with the Z wave ending at the horizontal resistance slightly below 0.382 Fib line.
The next significant support level on the way down is at around $8500 but depending on the momentum we might see further depreciation.
XRP/USD
From last Wednesday when the price of Ripple was at its highest point since the 6th of August and was sitting at $0.32103 we have seen a decrease of 17.09% measured to the lowest point the price has been today at $0.26617.
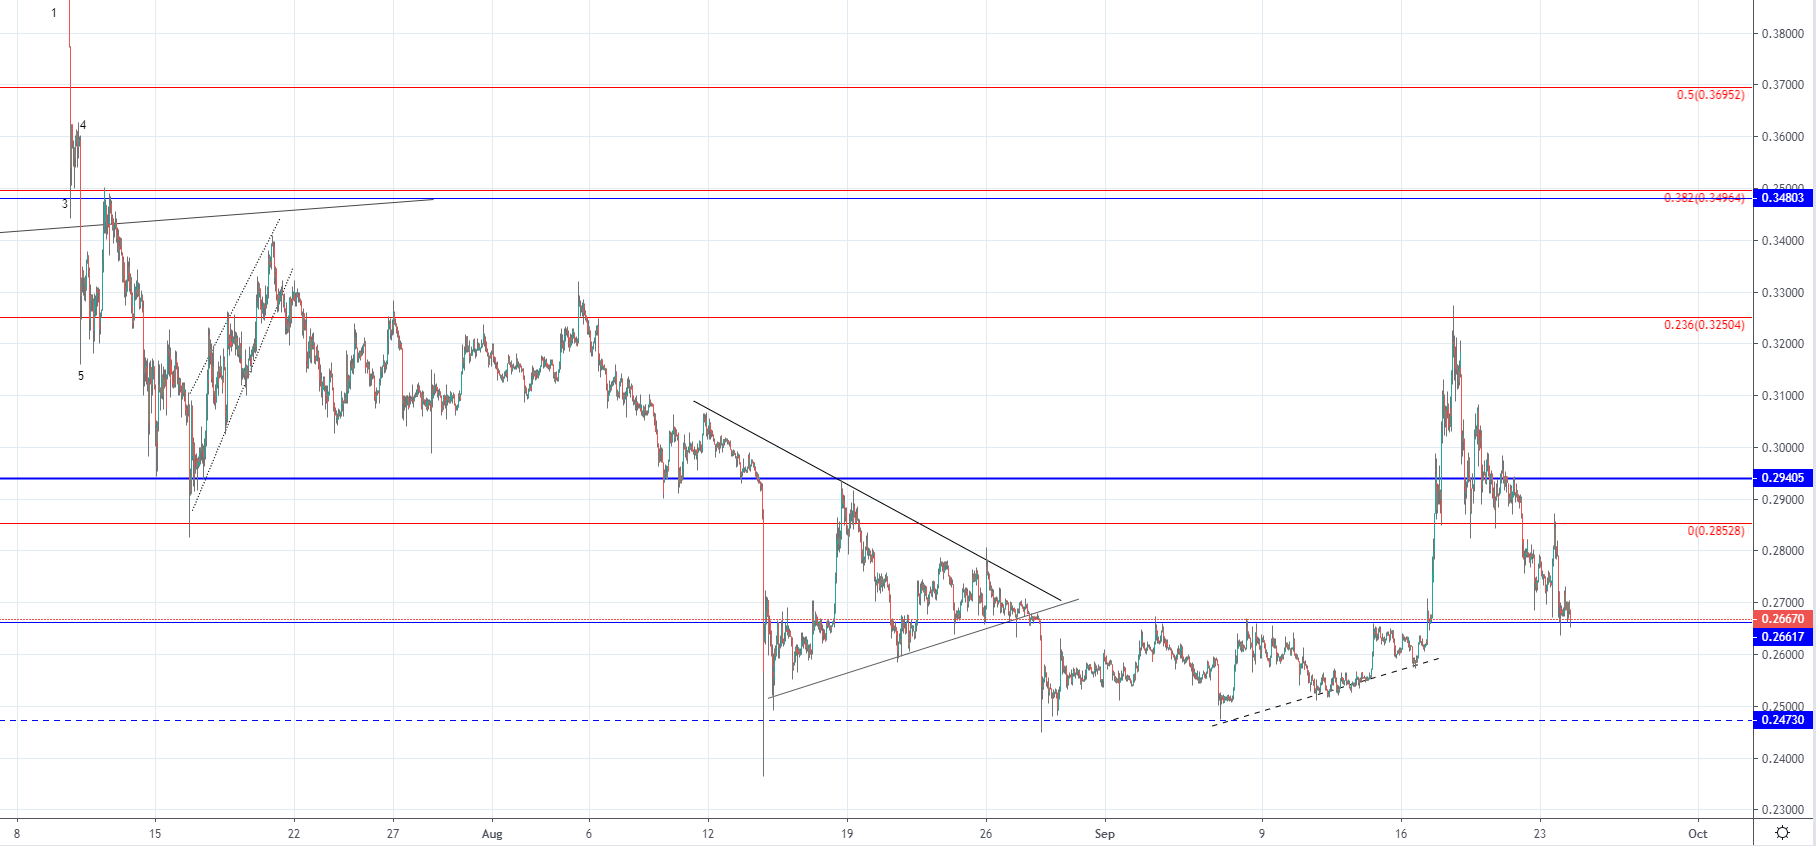 Looking at the hourly chart, we can see that the price came down to the significant horizontal level which was the resistance level from the horizontal range in which the price has been consolidating before breaking up to the upside above the more significant one at $0.29405. This seen bullish action could have been corrective as the third wave from the correction that began on the 16th of July.
The $0.29405 level should have served as major support if the bullish momentum was to continue but the price has disregarded the level altogether moving further to the lower one. If the currently interacted support level holds there could still be a possibility that the increase continues, but considering the momentum I think that a bounce from the current level would be a minor one before the price continue moving below.
FXOpen offers the world's most popular cryptocurrency CFDs*, including Bitcoin and Ethereum. Floating spreads, 1:2 leverage — at your service. Open your trading account now or learn more about crypto CFD trading with FXOpen.
*At FXOpen UK and FXOpen AU, Cryptocurrency CFDs are only available for trading by those clients categorised as Professional clients under FCA Rules and Professional clients under ASIC Rules respectively. They are not available for trading by Retail clients.
This article represents the opinion of the Companies operating under the FXOpen brand only. It is not to be construed as an offer, solicitation, or recommendation with respect to products and services provided by the Companies operating under the FXOpen brand, nor is it to be considered financial advice.
Latest articles

Anchored VWAP and How You Can Use It in Forex Trading
In the world of forex trading, understanding the nuanced tools at your disposal can significantly enhance decision-making processes. One such sophisticated tool is the Anchored Volume-Weighted Average Price (Anchored VWAP), which refines the standard VWAP by allowing traders to set

META Share Price Collapses after Publication of Quarterly Report
Just yesterday, META's stock price closed at USD 493.50, up approximately 40% since the start of 2024 and up nearly 300% since the start of 2023.
However, following the release of Meta's quarterly report, its shares plummeted to USD

USD/JPY Analysis: The Rate Exceeds The Level of 155 Yen Per US Dollar
Today, the price of USD/JPY once again renewed its 34-year high, exceeding the level of 155 yen per dollar, which put pressure on the current authorities.
According to Reuters, officials are trying to maintain calm in the market.
"We