


FXOpen

BTC/USD
Last Tuesday the price of Bitcoin spiked to $10400 at it’s highest point from where a decrease of 11.6% has been made reaching $9143 at it’s lowest. The price fell sharply to the downside below the starting point of the prior increase after which we have seen a minor recovery to $9859 at its highest point. Since then the price has fell back to the interrupted ascending trendline and made another attempt to break above the significant horizontal resistance zone but the attempt failed for now and is still being traded in a tight range.
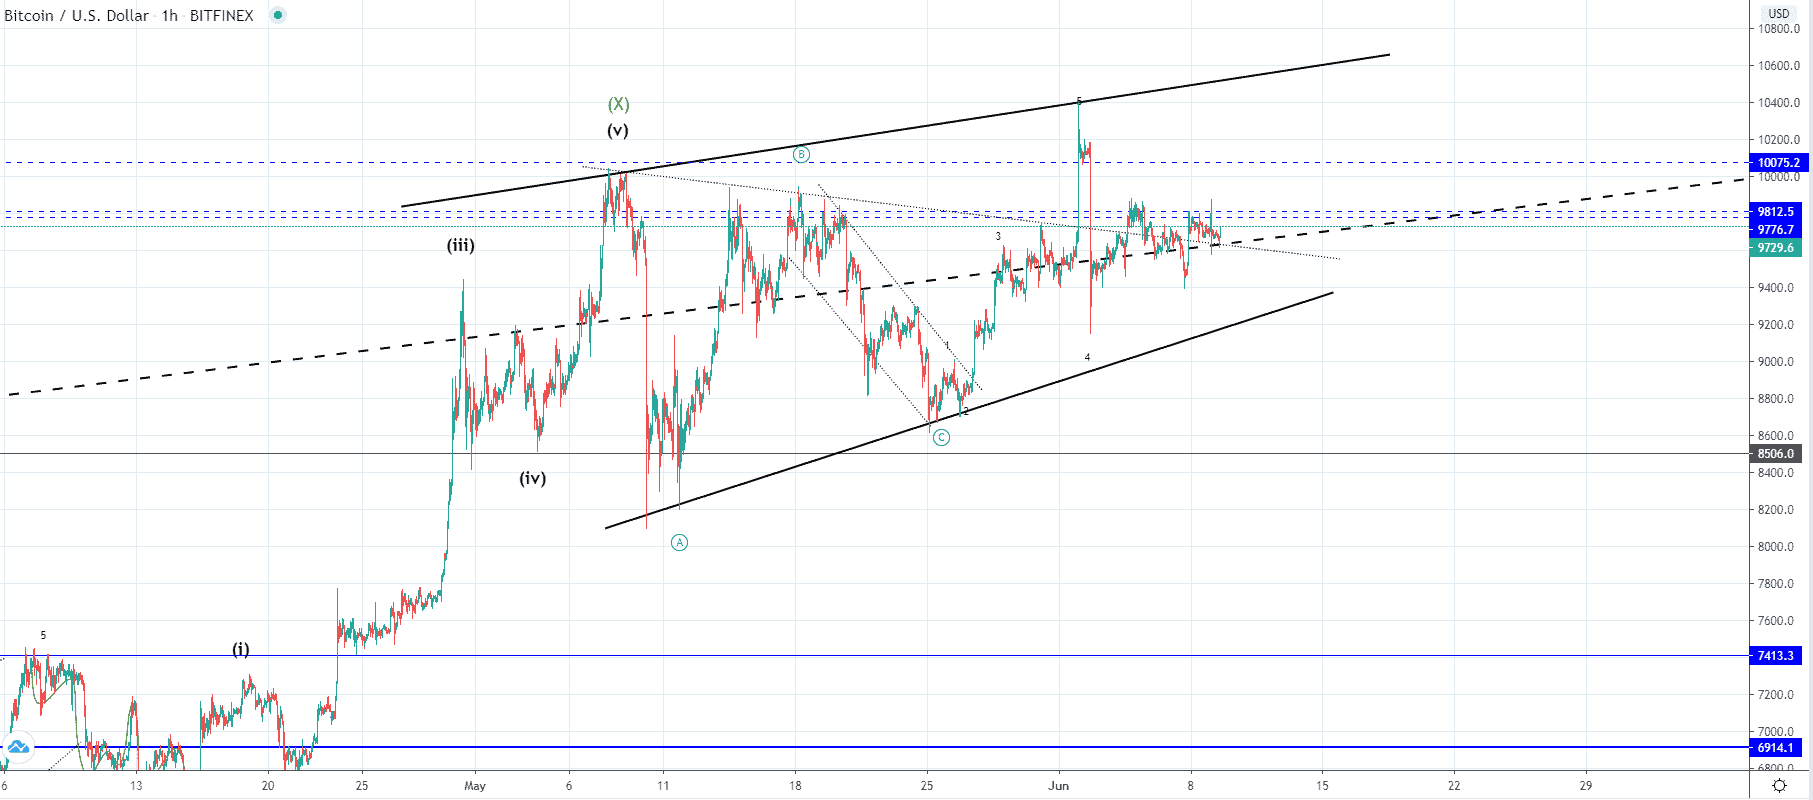 On the hourly chart, you can see that the price of Bitcoin has been moving in an ascending manner from the 11th of May when the first impulsive decrease was made to the $8500 area. This is why an ascending triangle started forming with the price retesting its resistance level on last Tuesday’s high. There are multiple significant levels intersecting at these levels which is why we are seeing this choppy price action because it is retesting them on either side.
Now as it again found resistance at the significant horizontal area but fell to the minor descending trendline where it found the support we are most likely to see another impulsive move that is to lead the price into a breakout. It is still unclear which direction the breakout could occur especially as the price is in the mid-range of the ascending structure but another retest of it’s outlined levels could be expected.
XRP/USD
The price of Ripple has followed a similar pattern to that of Bitcoin as an impulsive spike to the upside was made last Tuesday after which we have seen a descending move below its starting point. The decrease seen was of around 8.42% coming from $0.215 to $0.197 but started increasing immediately after and came up to retest the 1.272 Fibonacci level.
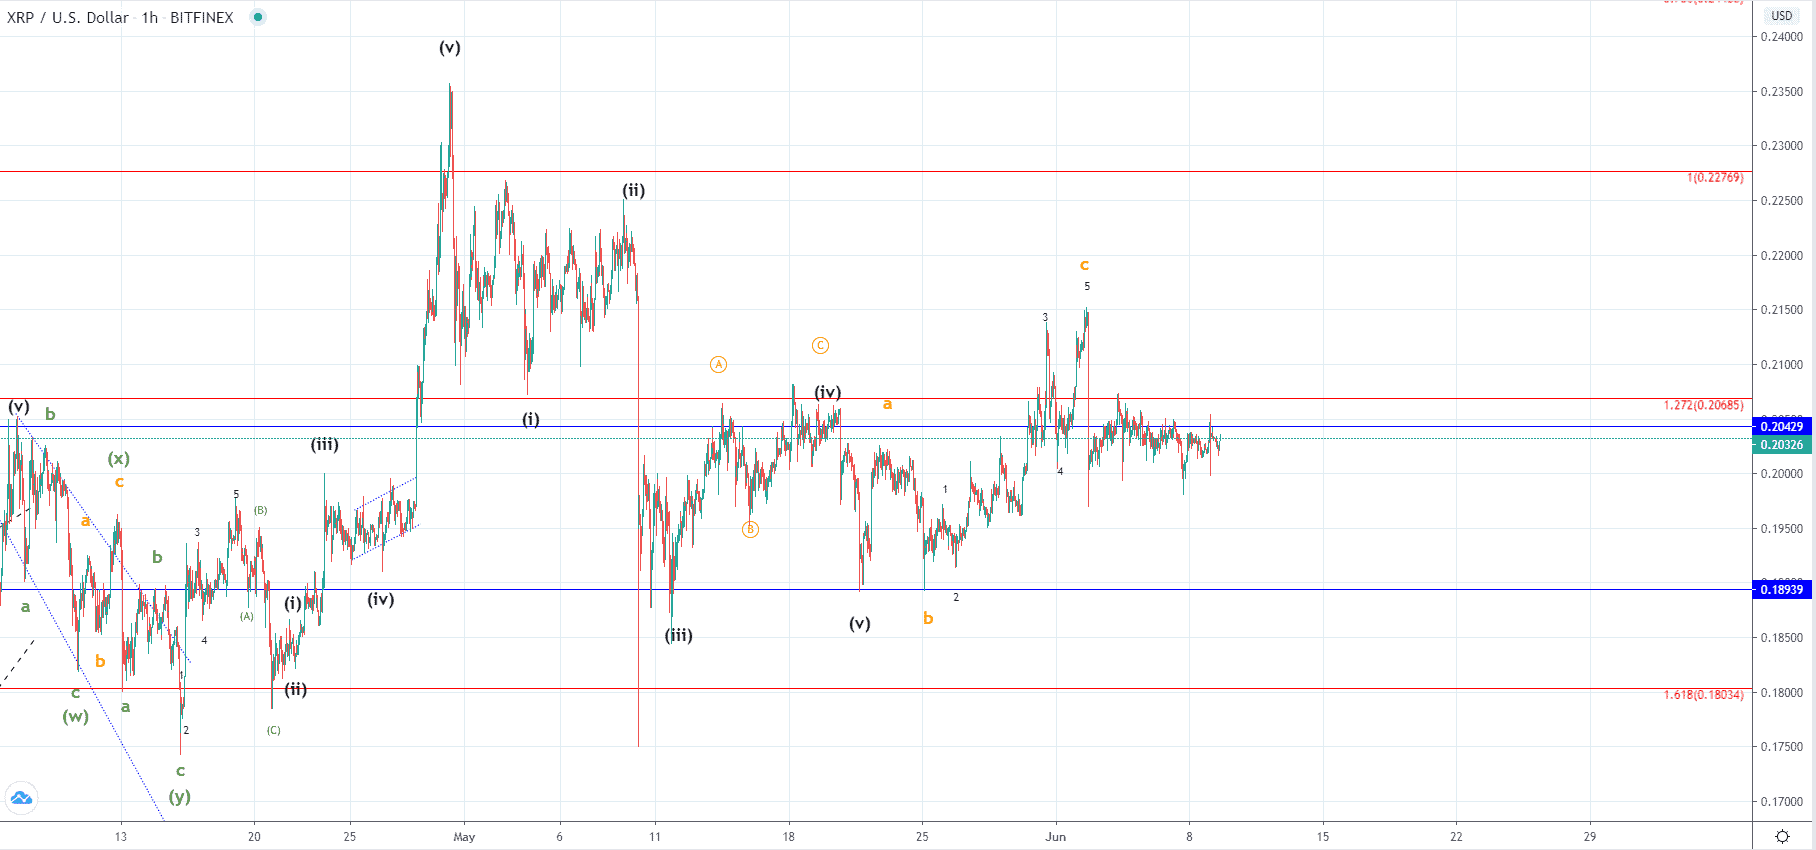 Looking at the hourly chart, you can see that the price found resistance at the Fib level and was moving sideways ever since, mostly below the lower significant horizontal level at $0.204. The wave structure implies that we have seen the completion of the ABC correction to the upside which is why a descending move from here would look likely, especially considering that we have seen the completion of a five-wave decrease followed by a three-wave one.
The price could, in theory, make another attempt for a breakout to the upside above the mentioned Fib level but I won’t believe that the breakout will be made as the sellers pressure looks stronger at the moment.
FXOpen offers the world's most popular cryptocurrency CFDs*, including Bitcoin and Ethereum. Floating spreads, 1:2 leverage — at your service. Open your trading account now or learn more about crypto CFD trading with FXOpen.
*At FXOpen UK and FXOpen AU, Cryptocurrency CFDs are only available for trading by those clients categorised as Professional clients under FCA Rules and Professional clients under ASIC Rules respectively. They are not available for trading by Retail clients.
This article represents the opinion of the Companies operating under the FXOpen brand only. It is not to be construed as an offer, solicitation, or recommendation with respect to products and services provided by the Companies operating under the FXOpen brand, nor is it to be considered financial advice.
Latest from Cryptocurrencies
Latest articles

Weekly Market Wrap With Gary Thomson: UK100, USD, GOLD, OIL
Get the latest scoop on the week's hottest headlines, all in one convenient video. Join Gary Thomson, the COO of FXOpen UK, as he breaks down the most significant news reports and shares his expert insights.
- UK100 Share Index Rises

What Is a Darvas Box Theory and How Does It Work in Trading?
The Darvas Box Theory, pioneered by Nicolas Darvas in the 1950s, has transcended its stock market origins to become a valuable tool for forex traders. This method leverages specific price movements and patterns, known as the Darvas Box, to track

NFLX Stock Price Falls Despite Subscriber Growth
Yesterday, after the close of the main trading session on the stock market, Netflix reported to investors for the 1st quarter of 2024.
The report turned out better than expected:
→ earnings per share: actual = USD 5.28, forecast = USD 4.