


FXOpen

BTC/USD
From last Friday when the price of Bitcoin was sitting at $8261 at its lowest point, we have seen an increase of over 10% as the price reached $9149 at its highest today. The price is currently being traded slightly lower but is still above $9000.
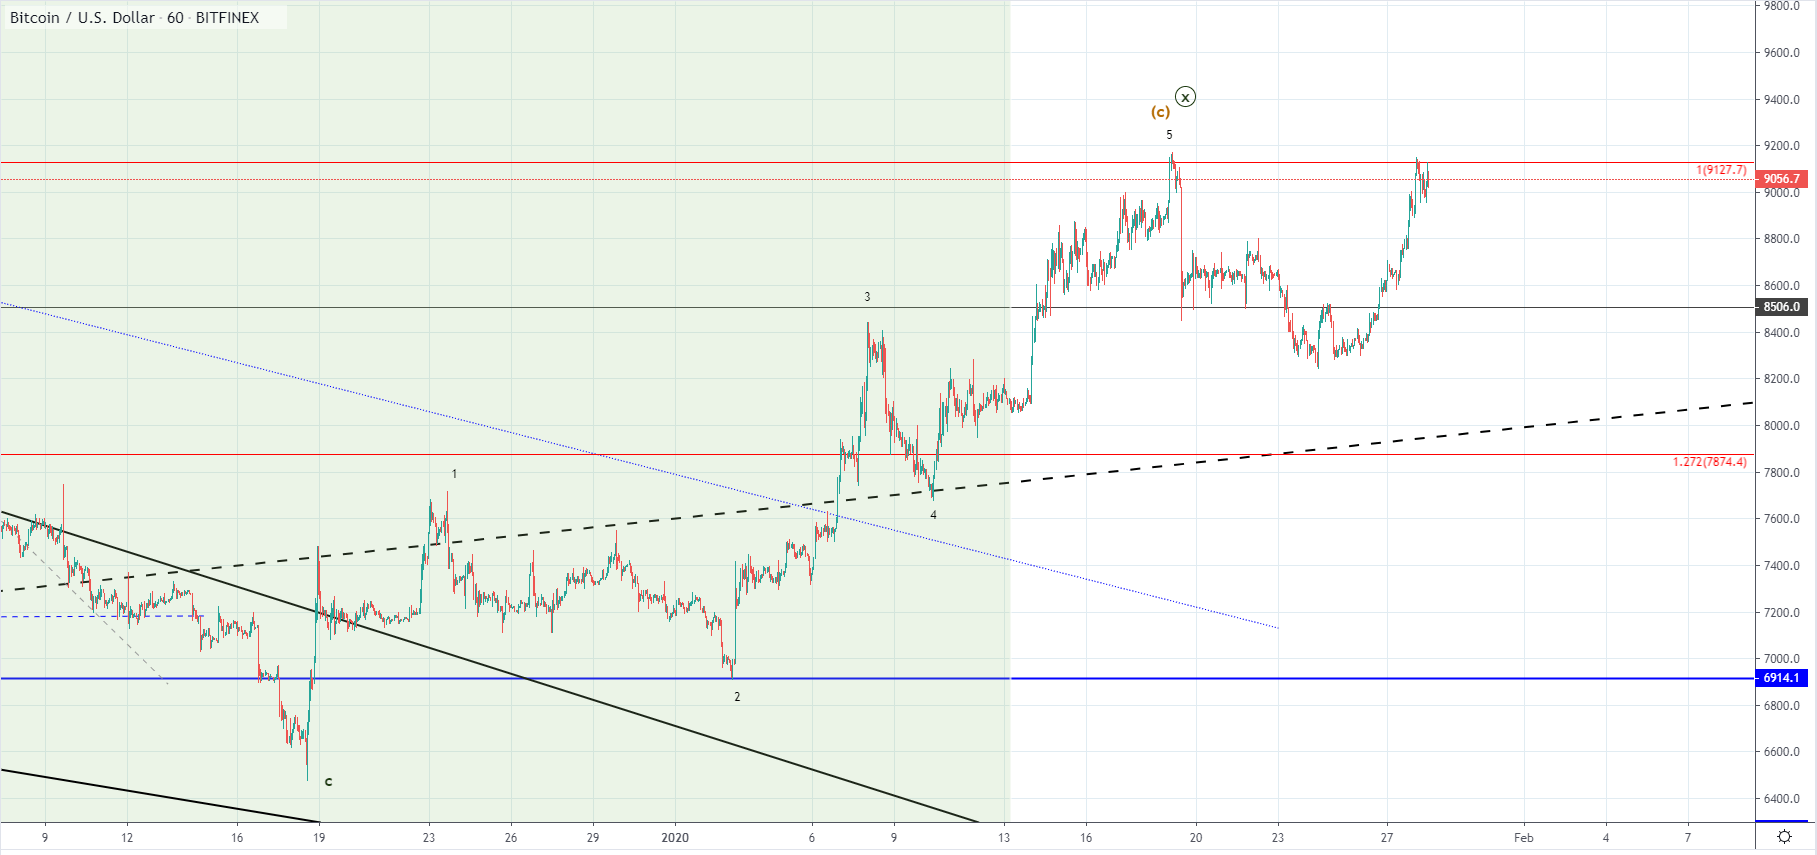
Looking at the hourly chart, you can see that it reached the 1 Fibonacci level at the vicinity of the prior high and was stopped out by the significant level, founding resistance there. The pattern from the 24th of January till today looks similar to the correction of a higher degree from June last year. This is why I would presume that the five-wave impulse has ended and that we are seeing the second corrective structure after it’s completion.
Another possibility would be that this upside move seen from last Friday is the continuation of the five-wave impulse in which case it would be its ending, 5th wave. If this is true then a minor retracement not below $8750 level should occur with another higher high surpassing the previous one made on the 19th of January.
In either way, from here I would be expecting a move to the downside from whose depth and momentum we are to re-evaluate the possibilities. More likely we have seen the end of the five-wave impulse and with it the C wave of a higher degree, which is why I would be expecting the price to start moving significantly lower. But if it manages to hold above the ascending trendline we could see further uptrend continuation.
XRP/USD
The price of Ripple has increased by 9.76% from last Friday coming from $0.214 to $0.235 at its highest point today. Currently, we have seen the momentum slowing down but the price is being traded around those levels.
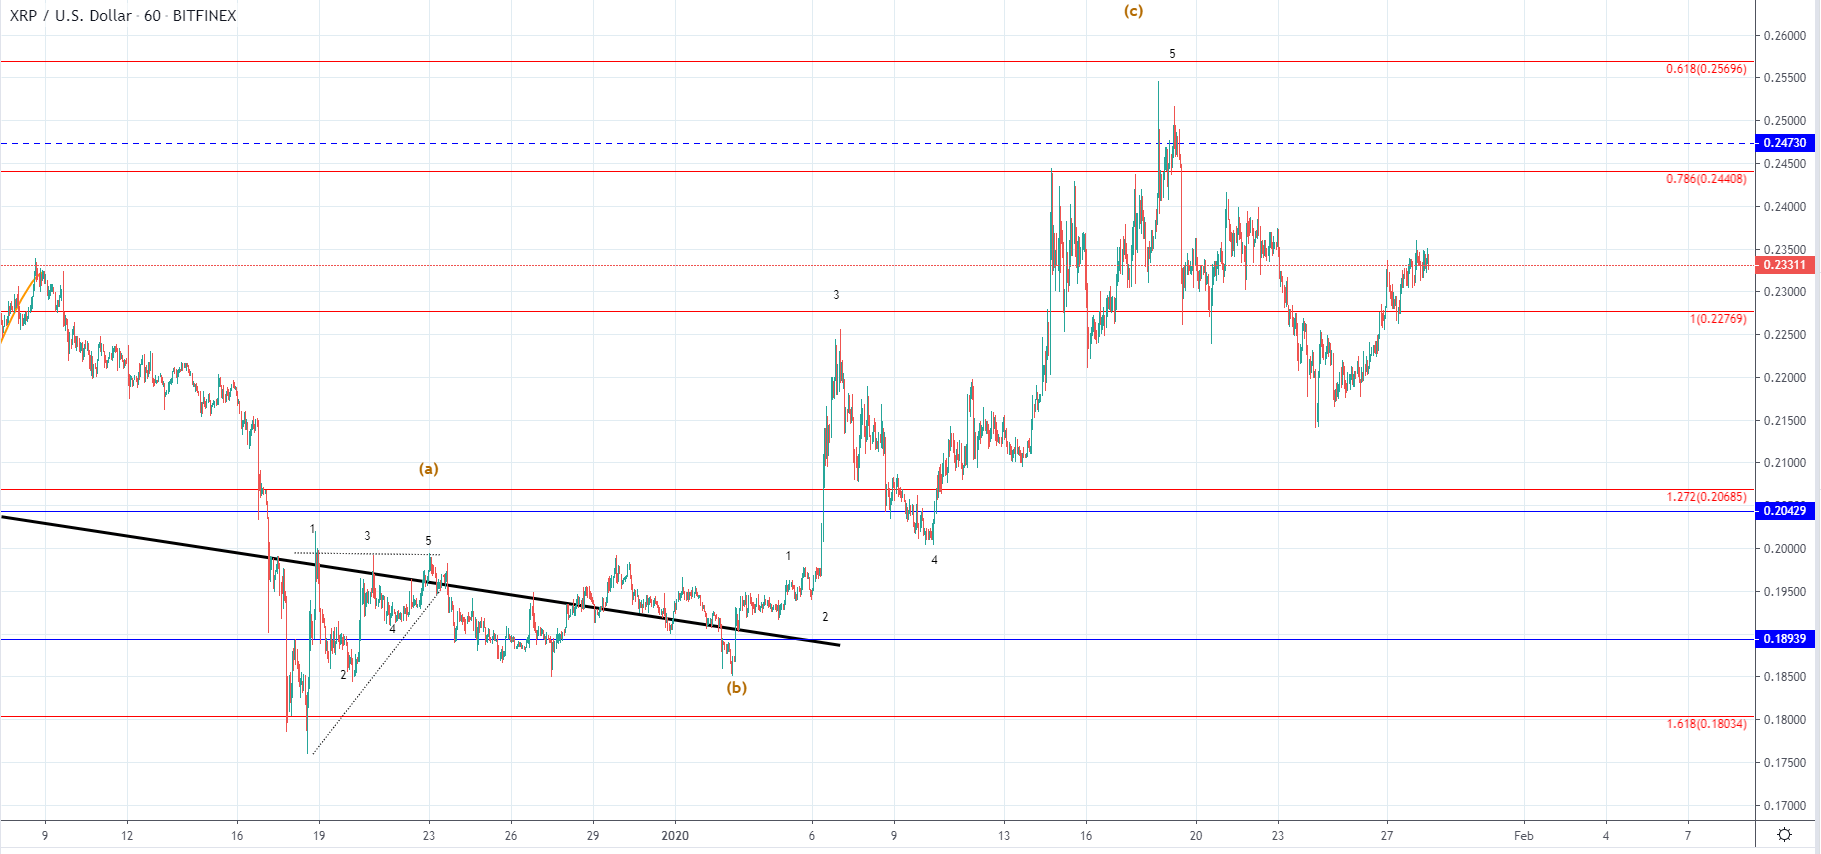
On the hourly chart, you can see that the price came above the 1 Fibonacci level but is struggling to continue moving to the 0.786 and unlike in the case of Bitcoin is far from the prior high. As we have seen a decrease of 15.76% from the “yearly high” to Friday’s low, this increase could be a corrective one and would be the 2nd wave out of the higher degree ABC correction.
This is presumed by the ending point of the 5th wave being at the yearly high, but it is still unclear whether or not we have seen an ABC correction of a higher degree to the upside. If we did that the price is now headed for a longer-term downtrend, but if those three waves were 123 from a five-wave impulse then the current increase would be it’s 5th wave and would lead the price of Ripple above the yearly high at $0.25435.
FXOpen offers the world's most popular cryptocurrency CFDs*, including Bitcoin and Ethereum. Floating spreads, 1:2 leverage — at your service. Open your trading account now or learn more about crypto CFD trading with FXOpen.
*At FXOpen UK and FXOpen AU, Cryptocurrency CFDs are only available for trading by those clients categorised as Professional clients under FCA Rules and Professional clients under ASIC Rules respectively. They are not available for trading by Retail clients.
This article represents the opinion of the Companies operating under the FXOpen brand only. It is not to be construed as an offer, solicitation, or recommendation with respect to products and services provided by the Companies operating under the FXOpen brand, nor is it to be considered financial advice.
Latest from Cryptocurrencies
Latest articles

Weekly Market Wrap With Gary Thomson: UK100, USD, GOLD, OIL
Get the latest scoop on the week's hottest headlines, all in one convenient video. Join Gary Thomson, the COO of FXOpen UK, as he breaks down the most significant news reports and shares his expert insights.
- UK100 Share Index Rises

What Is a Darvas Box Theory and How Does It Work in Trading?
The Darvas Box Theory, pioneered by Nicolas Darvas in the 1950s, has transcended its stock market origins to become a valuable tool for forex traders. This method leverages specific price movements and patterns, known as the Darvas Box, to track

NFLX Stock Price Falls Despite Subscriber Growth
Yesterday, after the close of the main trading session on the stock market, Netflix reported to investors for the 1st quarter of 2024.
The report turned out better than expected:
→ earnings per share: actual = USD 5.28, forecast = USD 4.