


FXOpen
BTC/USD
The price of Bitcoin came to $9127 at its highest point on Sunday making an interaction with the 1 Fibonacci level, but as the level served as resistance we have seen a rejection causing a decline of around 7.88% as it came to $8444 at it’s lowest. Currently, the price is being traded at $8663 and is above the significant horizontal level at $8506 which was retested for support.
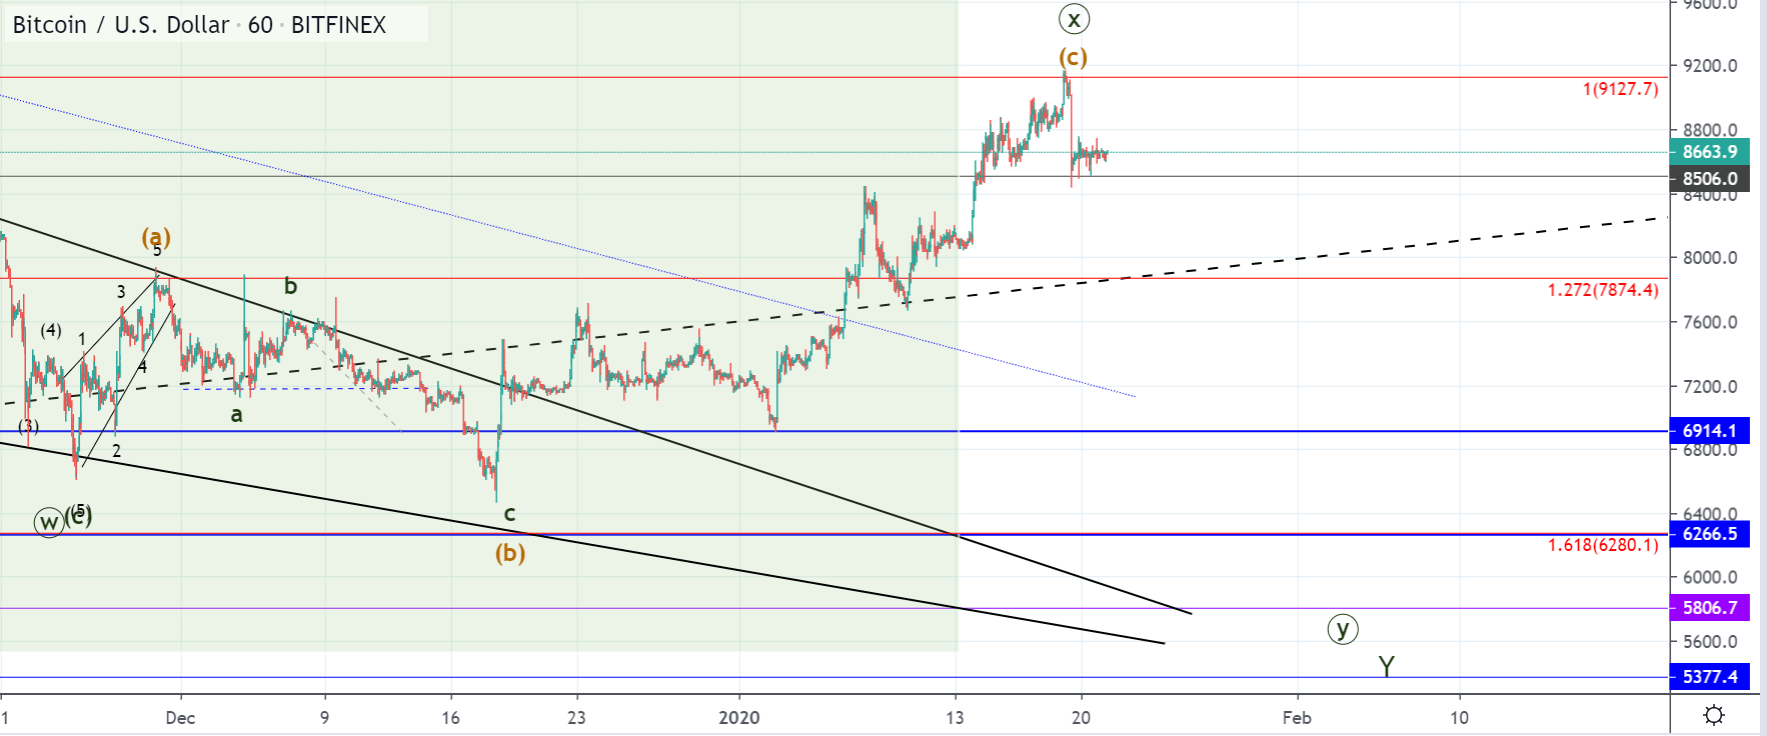 Looking at the hourly chart, you can see that the price of Bitcoin has been consolidating after the mentioned rejection and hasn’t changed much during yesterday. As we have seen a short decline, this minor range could be interpreted as a sign of consolidation before further downside movement.
The price of Bitcoin has been increasing since the interaction with the $6914 level which could have been the completion of the 2nd wave if we are seeing the development of a five-wave impulse. If this is true then the next retracement to $7702 at the interrupted ascending level could be its 4th wave which brings the interaction with the 1 Fib level as a potential ending point of the 5th wave.
In that case, the move to the downside could be of a higher degree and not just a minor retracement like the previous one. Another possibility would be that we are seeing another ABC to the upside developing in which case the C wave could go further to the upside before the downturn starts.
XRP/USD
From Sundays high at $0.2514 the price of Ripple has depreciated by 10.67% measured to the lowest point the price has been so far which is at $0.2246. At the moment the price being traded slightly higher at around $0.2365 and is in an upward trajectory. 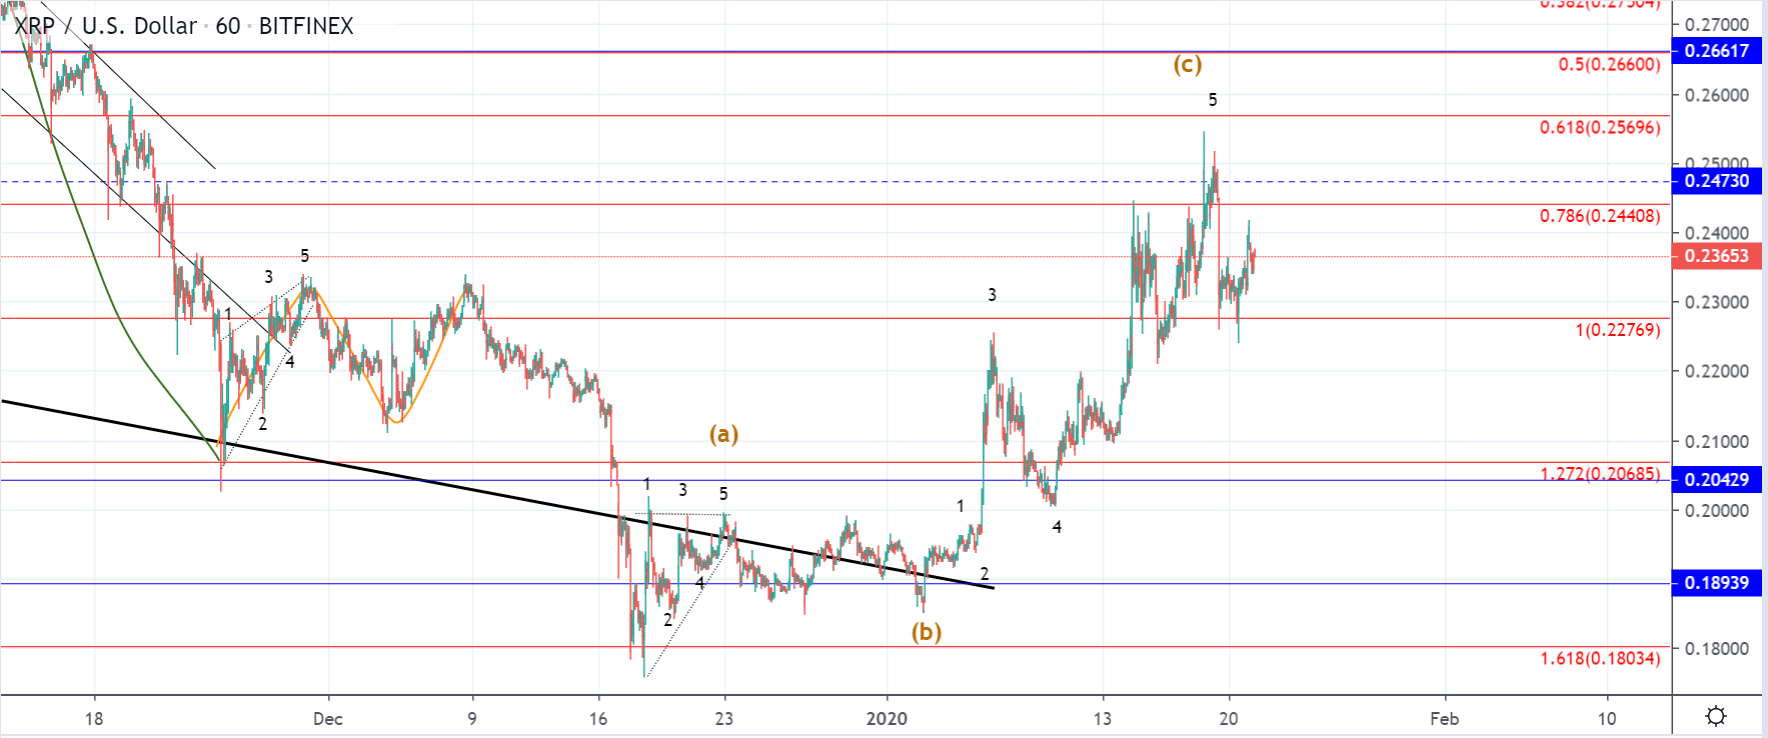 On the hourly chart, you can see the since the interaction with the $0.18939 horizontal support level we have seen an exponential increase in a parabolic manner for the price of Ripple of around 34%. Considering the amount of the price increase we could have seen the completion of the five-wave move to the upside but it is still unclear which structure it belongs to.
If we incorporate the previous move to the upside which was a minor ascending triangle we could be seeing the ABC to the upside which is corrective in nature. If this is true then the price is immediately heading for further lows and the ascending structure should be broken any time soon.
If however, the price hasn’t ended the development of its 5th wave the currently seen upside move should push the price to surpassing the previous high.
FXOpen offers the world's most popular cryptocurrency CFDs*, including Bitcoin and Ethereum. Floating spreads, 1:2 leverage — at your service. Open your trading account now or learn more about crypto CFD trading with FXOpen.
*At FXOpen UK and FXOpen AU, Cryptocurrency CFDs are only available for trading by those clients categorised as Professional clients under FCA Rules and Professional clients under ASIC Rules respectively. They are not available for trading by Retail clients.
This article represents the opinion of the Companies operating under the FXOpen brand only. It is not to be construed as an offer, solicitation, or recommendation with respect to products and services provided by the Companies operating under the FXOpen brand, nor is it to be considered financial advice.
Latest articles

Anchored VWAP and How You Can Use It in Forex Trading
In the world of forex trading, understanding the nuanced tools at your disposal can significantly enhance decision-making processes. One such sophisticated tool is the Anchored Volume-Weighted Average Price (Anchored VWAP), which refines the standard VWAP by allowing traders to set

META Share Price Collapses after Publication of Quarterly Report
Just yesterday, META's stock price closed at USD 493.50, up approximately 40% since the start of 2024 and up nearly 300% since the start of 2023.
However, following the release of Meta's quarterly report, its shares plummeted to USD

USD/JPY Analysis: The Rate Exceeds The Level of 155 Yen Per US Dollar
Today, the price of USD/JPY once again renewed its 34-year high, exceeding the level of 155 yen per dollar, which put pressure on the current authorities.
According to Reuters, officials are trying to maintain calm in the market.
"We