


FXOpen

BTC/USD
From last week when the price of Bitcoin was trading at around $9950 at its lowest point, we have seen an increase of 8.86%. This is measured to the current price point at $10816.9 which is the highest price has been this week. The price is an upward trajectory with strong bullish momentum as it started spiking by 1.69% today coming from $10637 daily low to the current high.
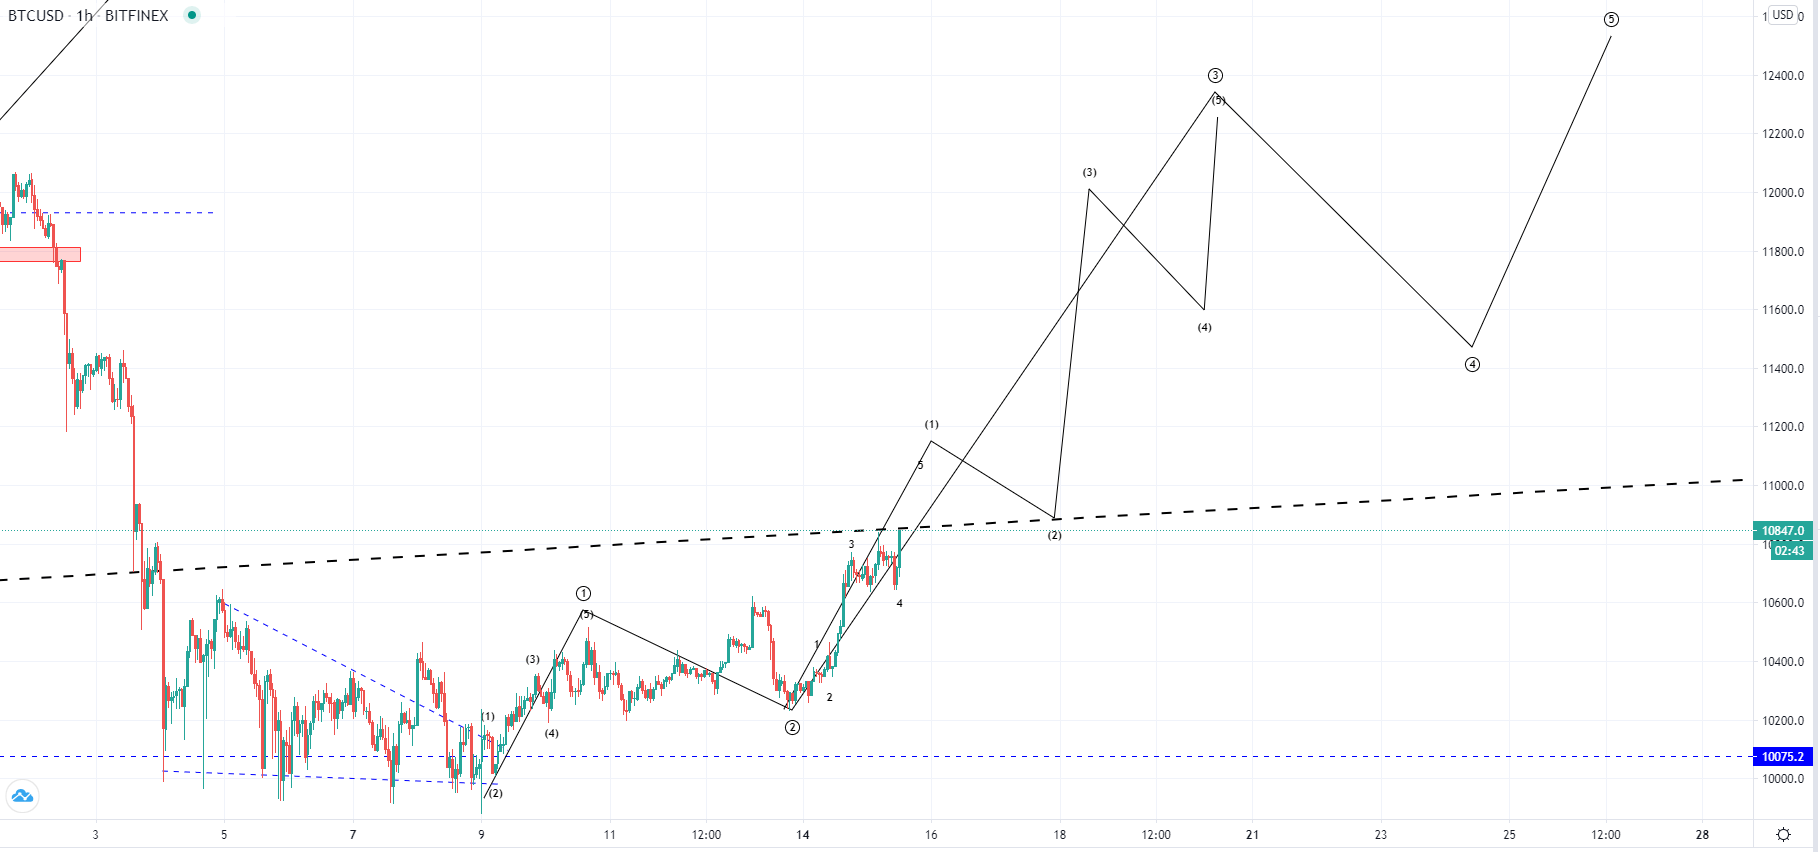
On the hourly chart, you can see that the price made a breakout from last week’s descending triangle after a third retest of the $10000 zone. As the price found support there and a couple of dips below it found the initial price chase as it activated buying we have seen an impulsive move to the upside. It first came to retest the triangle’s high level forming a minor cup and handle. The handle which was formed from last Thursday to Monday low was indicative of further price growth.
These two structures are very likely the first two sub-wave of the higher degree five-wave move to the upside. This is so if we have seen the completion of the corrective move that started on the 2nd of August when the price first reached $12000. If the correction ended last week dipping just slightly below $10000 then another 5th wave of an even higher degree count is set to start and bring the price of Bitcoin above it prior to $12000 high, and potentially into the area of last years June and July at around $13500.
But now as the price is currently retesting the significant ascending trendline and is showing the completion of the 5th wave from the minuscule count we are like to see a minor breakout above the significant level and its retest for support on its 2nd wave for the submicro count.
XRP/USD
Yesterday the price of Ripple has been sitting at $0.23782 at its lowest point and from there made an increase of 4.74% coming to $0.24910 at its highest. At the moment the price is being traded slightly lower but has mostly been in an upward trajectory today spiking above its minor horizontal pivot point.
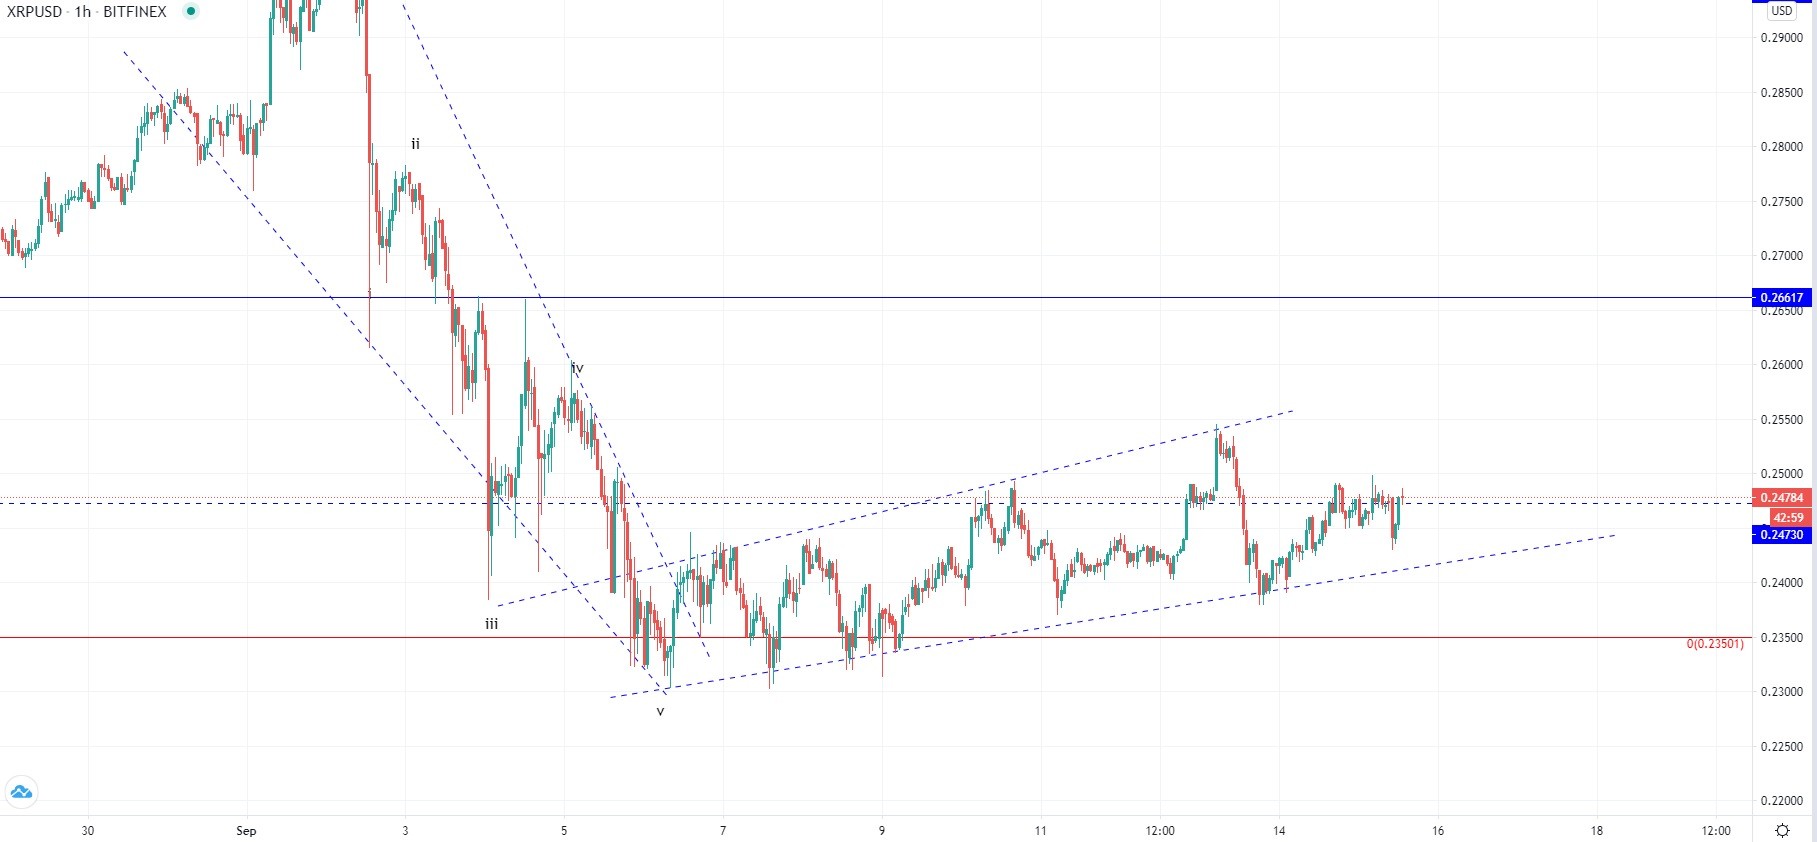
Looking at the hourly chart, you can see that from last week an ascending channel was formed in which the price bounced and made higher high and lower lows. Unlike in the case of Bitcoin where we have seen a clear impulsive move, the price action of Ripple has shown a more steady pattern. This could indicate that the recovery seen from last week is still corrective in nature and we are to see further lows after it ends. In that case, it would indicate that the correction for the higher degree and started on the 2nd of August hasn’t ended.
In the near-term, another increase would be expected from the price of Ripple potentially as a retest of the next significant horizontal level to the upside which is at $0.26617. If however, the ascending channel turns out to be a leading diagonal the price would be set to continue increasing in a sustainable way coming above it previous high at $0.3 area.
FXOpen offers the world's most popular cryptocurrency CFDs*, including Bitcoin and Ethereum. Floating spreads, 1:2 leverage — at your service. Open your trading account now or learn more about crypto CFD trading with FXOpen.
*At FXOpen UK and FXOpen AU, Cryptocurrency CFDs are only available for trading by those clients categorised as Professional clients under FCA Rules and Professional clients under ASIC Rules respectively. They are not available for trading by Retail clients.
This article represents the opinion of the Companies operating under the FXOpen brand only. It is not to be construed as an offer, solicitation, or recommendation with respect to products and services provided by the Companies operating under the FXOpen brand, nor is it to be considered financial advice.
Latest from Cryptocurrencies
Latest articles

Weekly Market Wrap With Gary Thomson: UK100, USD, GOLD, OIL
Get the latest scoop on the week's hottest headlines, all in one convenient video. Join Gary Thomson, the COO of FXOpen UK, as he breaks down the most significant news reports and shares his expert insights.
- UK100 Share Index Rises

What Is a Darvas Box Theory and How Does It Work in Trading?
The Darvas Box Theory, pioneered by Nicolas Darvas in the 1950s, has transcended its stock market origins to become a valuable tool for forex traders. This method leverages specific price movements and patterns, known as the Darvas Box, to track

NFLX Stock Price Falls Despite Subscriber Growth
Yesterday, after the close of the main trading session on the stock market, Netflix reported to investors for the 1st quarter of 2024.
The report turned out better than expected:
→ earnings per share: actual = USD 5.28, forecast = USD 4.