


FXOpen

BTC/USD
Last Friday the price of Bitcoin came down to around $10455 area from its second attempt to surpass the $10931 level which ended as a failure. Since this drop of around 4.5% occurred we have seen the formation of an ascending channel in which the price action bounced until today when a minor breakout started developing after the price reached $10818 at its highest.
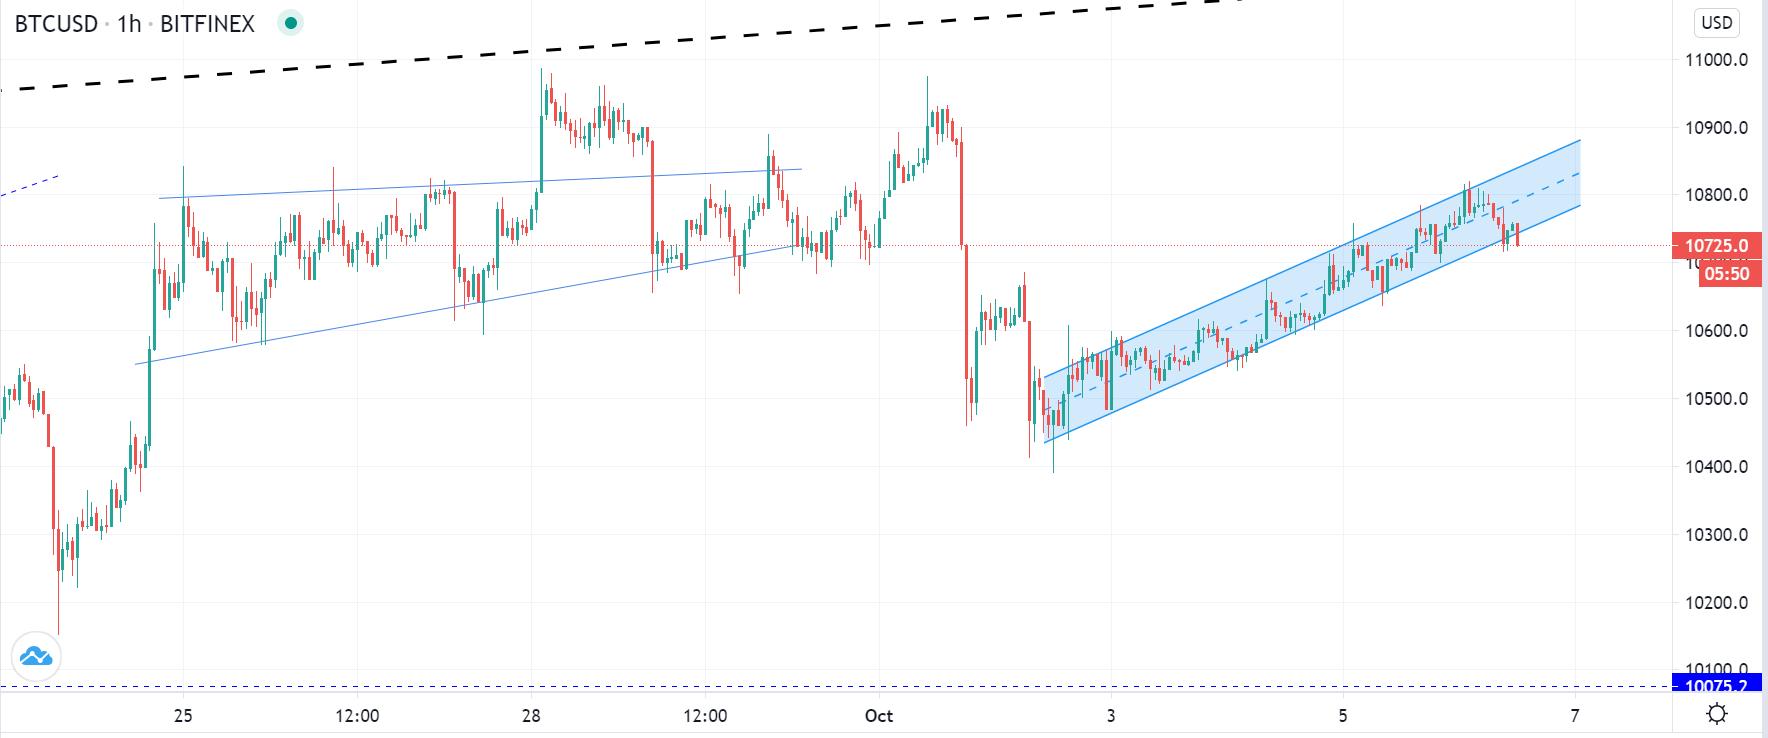
The price came above its significant horizontal support that served as resistance at around $10700 but it is struggling to keep up the upward momentum. On the hourly chart, we can see that it appears that a breakout is currently being made with the current hourly candle being opened below the channels support level.
This is why we are likely to see a breakout continuation to at least $10650 or $10590 where the next significant horizontal support levels are and make the support zone which was broken on the 1st of October.
If the price finds support there and continues moving above $10700 area then the ascending channel could have been the next sub-wave of the upward impulse wave but if the price goes below the mentioned support zone the ascending channel would have likely been a corrective structure after which further lows could be seen.
XRP/USD
The price of Ripple has increased further then in the case of Bitcoin as from its last Friday’s low at $0.23 we have seen an increase of 13% measured to its highest point at $0.26 made today. As the price reached today’s high it started impulsively declining and is currently being traded just slightly below $0.25 level but a breakout has been made below the ascending trendline.
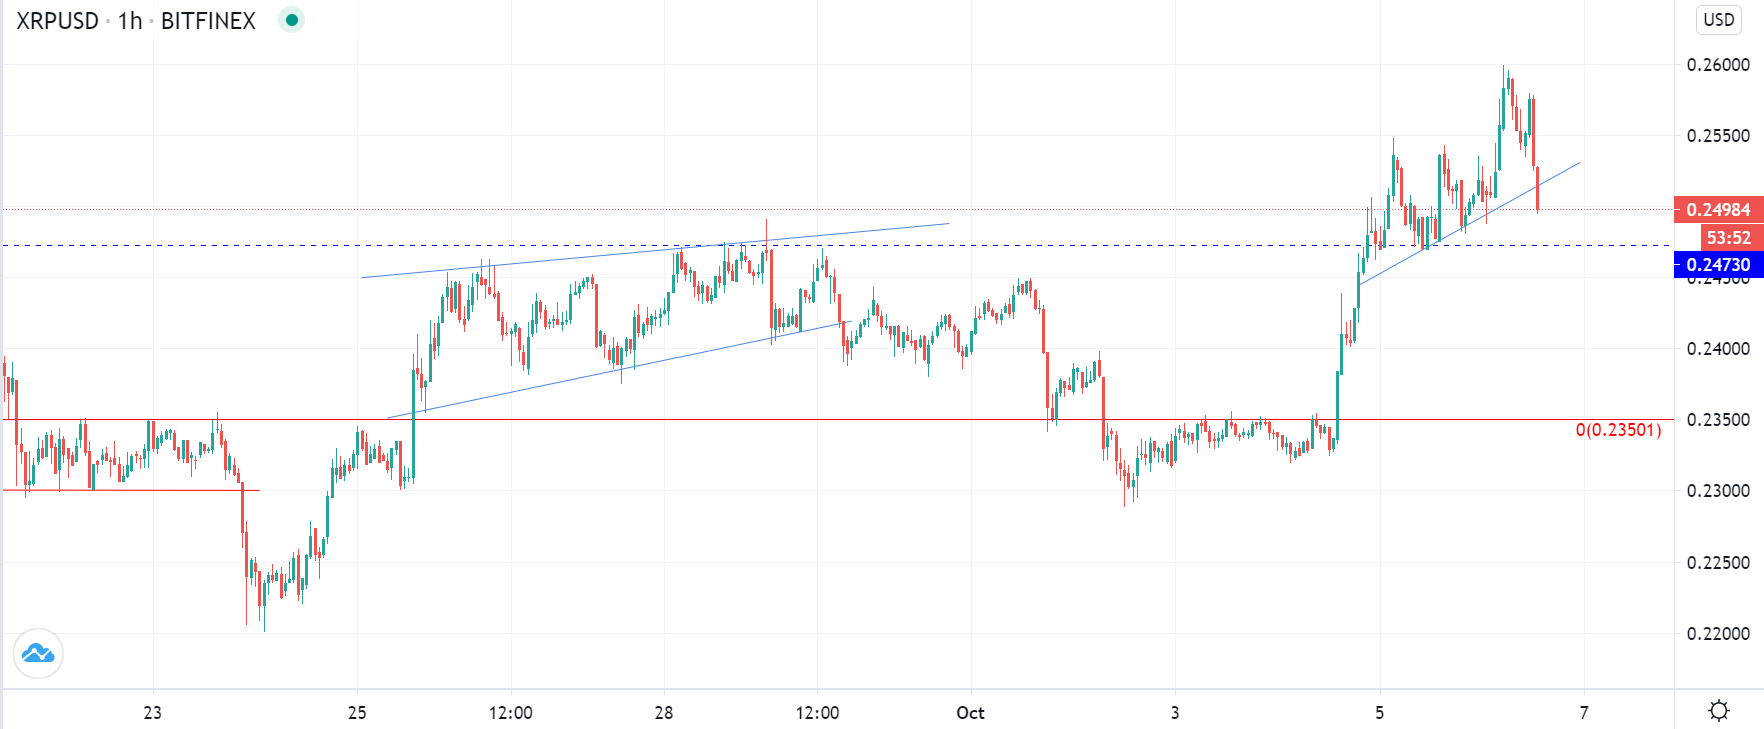
Yesterday the price found support on the horizontal level at $0.24730 which is why another interaction now looks highly likely but it is still unclear whether or not the price is going to find support there for the second time. This is the level from the prior high made on the 28th of September which is why its retest could be seen again, especially if the price wants to continue its upward movement.
Considering that we have seen a higher low last Friday, October the 2nd compared to the one made on the 24th of September an uptrend continuation looks likely at this stage. This is why the horizontal level at $0.24730 will serve as a pivot point whose interaction is going to provide an early indication on whether or not the uptrend is to continue in the upcoming period.
FXOpen offers the world's most popular cryptocurrency CFDs*, including Bitcoin and Ethereum. Floating spreads, 1:2 leverage — at your service. Open your trading account now or learn more about crypto CFD trading with FXOpen.
*At FXOpen UK and FXOpen AU, Cryptocurrency CFDs are only available for trading by those clients categorised as Professional clients under FCA Rules and Professional clients under ASIC Rules respectively. They are not available for trading by Retail clients.
This article represents the opinion of the Companies operating under the FXOpen brand only. It is not to be construed as an offer, solicitation, or recommendation with respect to products and services provided by the Companies operating under the FXOpen brand, nor is it to be considered financial advice.
Latest from Cryptocurrencies
Latest articles

Weekly Market Wrap With Gary Thomson: UK100, USD, GOLD, OIL
Get the latest scoop on the week's hottest headlines, all in one convenient video. Join Gary Thomson, the COO of FXOpen UK, as he breaks down the most significant news reports and shares his expert insights.
- UK100 Share Index Rises

What Is a Darvas Box Theory and How Does It Work in Trading?
The Darvas Box Theory, pioneered by Nicolas Darvas in the 1950s, has transcended its stock market origins to become a valuable tool for forex traders. This method leverages specific price movements and patterns, known as the Darvas Box, to track

NFLX Stock Price Falls Despite Subscriber Growth
Yesterday, after the close of the main trading session on the stock market, Netflix reported to investors for the 1st quarter of 2024.
The report turned out better than expected:
→ earnings per share: actual = USD 5.28, forecast = USD 4.