


FXOpen

BTC/USD
From last week’s high made on Wednesday at $9489, the price of Bitcoin has decreased by 4% measured to today’s low at $9109.9. Currently, the price is being traded at $9230 as a minor recovery has been made but is overall in a downward trajectory.
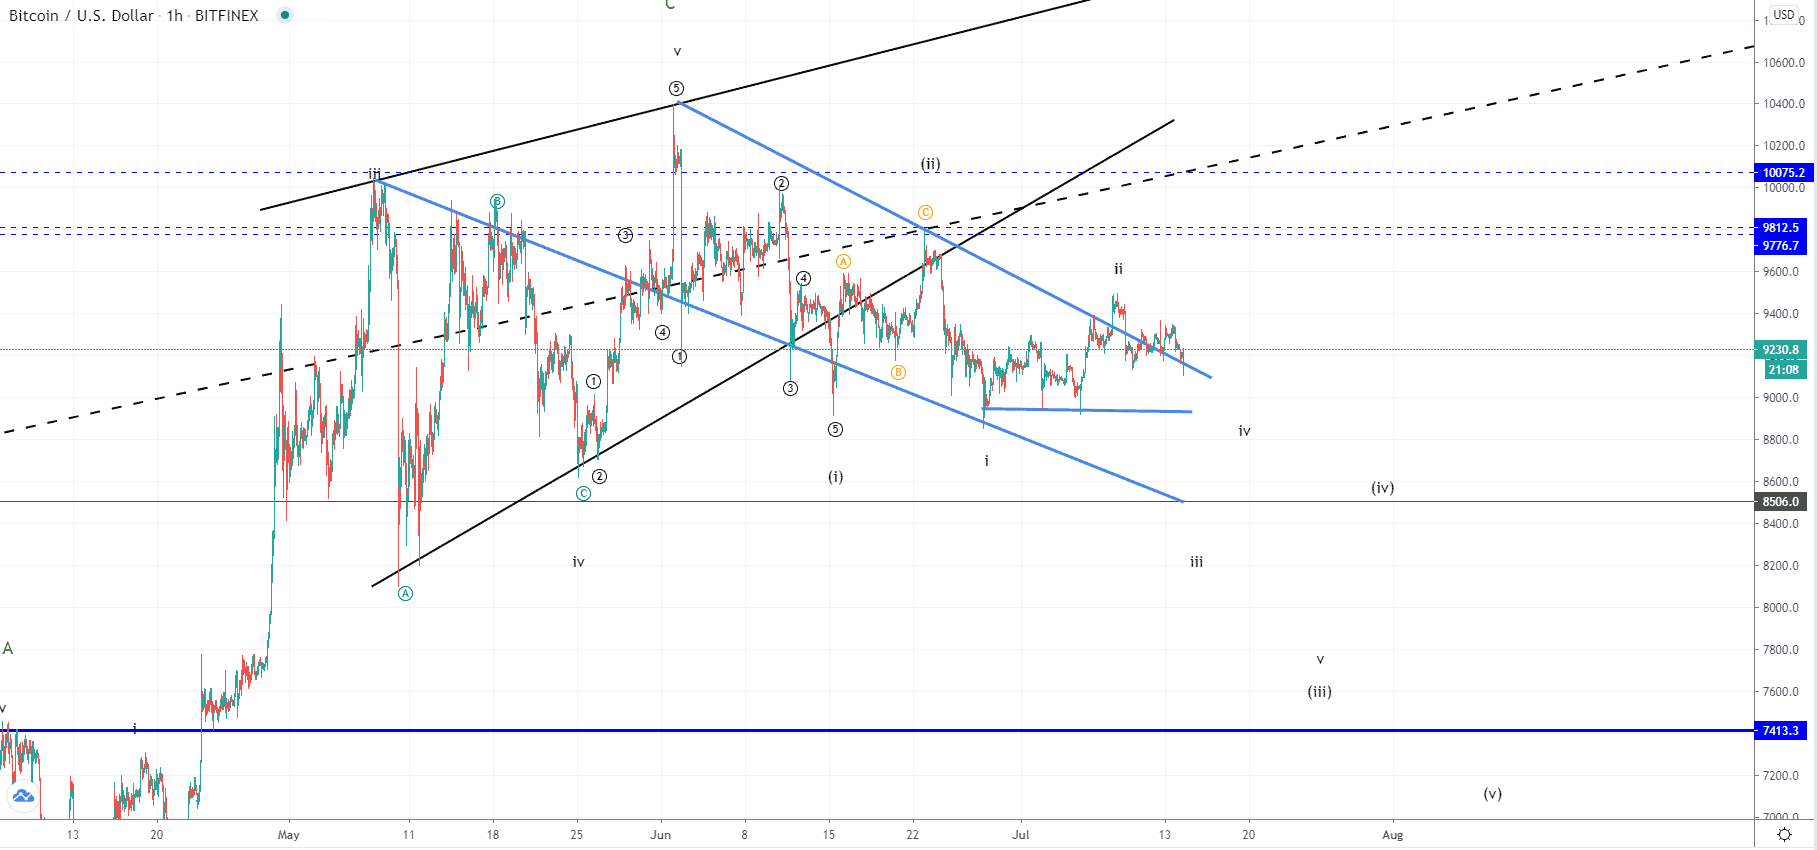 Looking at the hourly chart, you can see that the price has attempted to break out from the descending channel in which it was since the start of June but fell back inside its territory last Friday but is now again retesting its resistance line from the upper side for support another attempt is being made. Today’s lowest point spiked to the downside inside the territory of the mentioned descending structure and has bounced above leaving a spike on the hourly chart.
This indicates bullishness as the buyer’s pressure pushed the price back above the significant level validating the support, but since the level is still being tested we are yet to see if it holds or are we to see another fakeout. The wave structure implies that further downside should be expected from the current levels as we have most likely seen a corrective wave to the upside. If however, the price continues increasing from here as it finds support and goes above the last week’s high the count would be invalidated as we have seen the development of a five-wave impulse instead of the three-wave correction to the upside.
XRP/USD
The price of Ripple has continued increasing from our last projection making the prior count invalidated but it appears that we have seen the completion of the 5th wave to the upside and the end of the impulsive increase after which a symmetrical triangle started forming. Yesterday the price came up to establish the resistance level from the symmetrical triangle and after a test, we have seen a rejection pushing the price for a 5.51% decrease coming from $0.20693 to $0.19553 at its lowest point today. At the moment the price is hovering just slightly below the $0.2 mark and is in an upward trajectory.
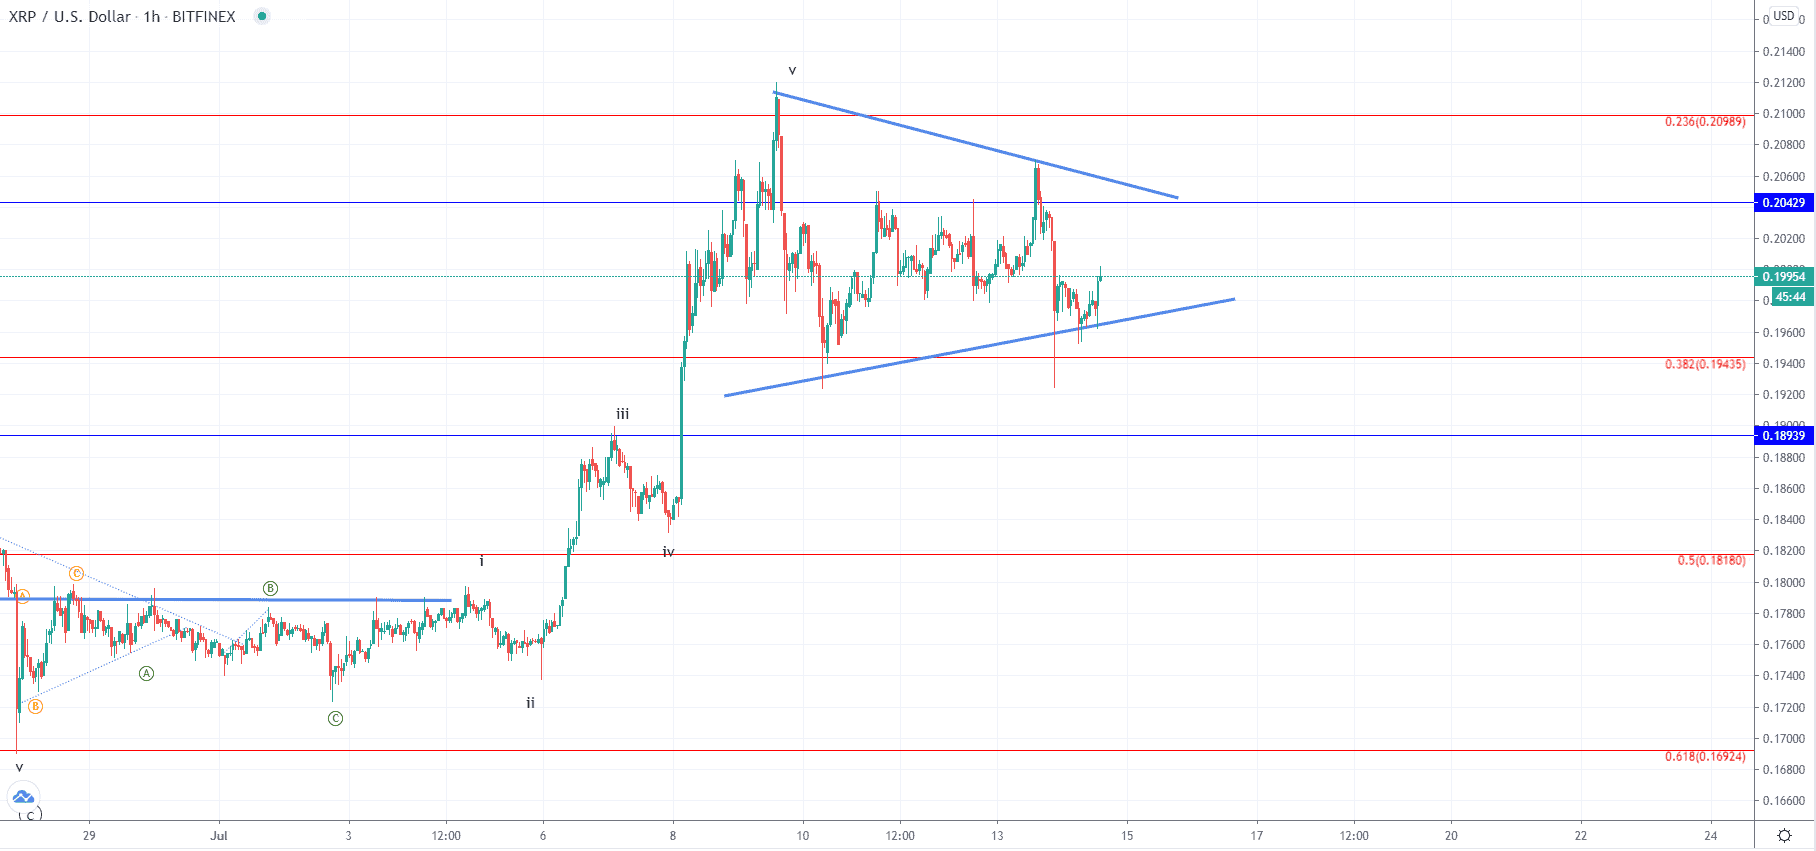 As you can see by looking at the hourly chart, the price is retesting a minor horizontal level for resistance and appears that the resistance is present at those levels as indicated by the wick from the seller’s side on the hourly candle. The prior decline was made in a five-wave manner indicating impulsiveness which is why a breakout to the downside from the symmetrical triangle would be expected as the current wave to the upside appears to be corrective in nature.
If this is true then further upside movement could be seen as the corrective structure develops fully, potentially retesting the triangle’s resistance once more before we can see a proper breakout to the downside.
FXOpen offers the world's most popular cryptocurrency CFDs*, including Bitcoin and Ethereum. Floating spreads, 1:2 leverage — at your service. Open your trading account now or learn more about crypto CFD trading with FXOpen.
*At FXOpen UK and FXOpen AU, Cryptocurrency CFDs are only available for trading by those clients categorised as Professional clients under FCA Rules and Professional clients under ASIC Rules respectively. They are not available for trading by Retail clients.
This article represents the opinion of the Companies operating under the FXOpen brand only. It is not to be construed as an offer, solicitation, or recommendation with respect to products and services provided by the Companies operating under the FXOpen brand, nor is it to be considered financial advice.
Latest articles

Anchored VWAP and How You Can Use It in Forex Trading
In the world of forex trading, understanding the nuanced tools at your disposal can significantly enhance decision-making processes. One such sophisticated tool is the Anchored Volume-Weighted Average Price (Anchored VWAP), which refines the standard VWAP by allowing traders to set

META Share Price Collapses after Publication of Quarterly Report
Just yesterday, META's stock price closed at USD 493.50, up approximately 40% since the start of 2024 and up nearly 300% since the start of 2023.
However, following the release of Meta's quarterly report, its shares plummeted to USD

USD/JPY Analysis: The Rate Exceeds The Level of 155 Yen Per US Dollar
Today, the price of USD/JPY once again renewed its 34-year high, exceeding the level of 155 yen per dollar, which put pressure on the current authorities.
According to Reuters, officials are trying to maintain calm in the market.
"We