


FXOpen
Since our last BTC update on Thursday, prices rallied an extra $25 dollars to hit a high close to $450 dollars on most exchanges. This propelled its little brother Litecoin to join the rally. But in the past three days both cryptos have retraced somewhat. Let’s start with big brother first and we’ll come back to Litecoin later.
Bitcoin Retraces Over $30 Dollars
Bitcoin retraced over $30 dollars from the highs reached on February 21st. We are currently quoted at $421.97 on Fxopen, slightly above the lows reached earlier in the session. On the chart below we can see that in the grand scheme of things, this retracement is not very large. (Note that due to an outage at FxOpen/BTC-E, this chart doesn’t capture the entire rally to $448-$450.) Bitcoin has rallied over $70 dollars from a low of $374.08 on February 9th. After such a strong rally, a sharp correction was inevitable at some point.
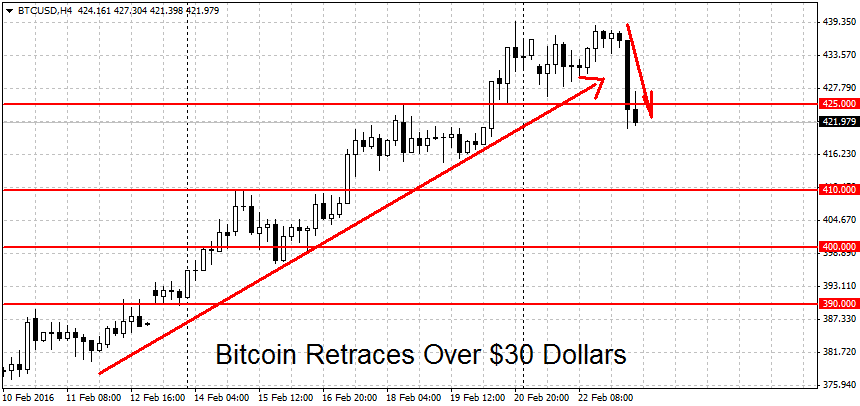
Still, the bulls have to realize that the momentum is no longer in their favor. The trend is still up and the bears will have to push BTC/USD below $390 to end it. But to regain the bullish momentum, bitcoin will have to stage a decisive breakout above the $450 dollars resistance. Higher up we find another strong resistance at $460 dollars per coin. A clean move above here could extend the gains toward the $500 round figure, last year’s high for BTC.
On the lower end, weak support can be found at $410 and $400 dollars per coin. Like we said above, the current rally would technically end on a break of $390 dollars. Below here we have weak support at $374 and $365 dollars, followed by a much stronger level at $350 dollars per coin.
Litecoin Breaks Out
After a long period stuck in a range, Litecoin finally staged a breakout, joining BTC in the rally. Initially prices surged to a high of $3.488 but we have since fallen back to $3.372 dollars per coin.
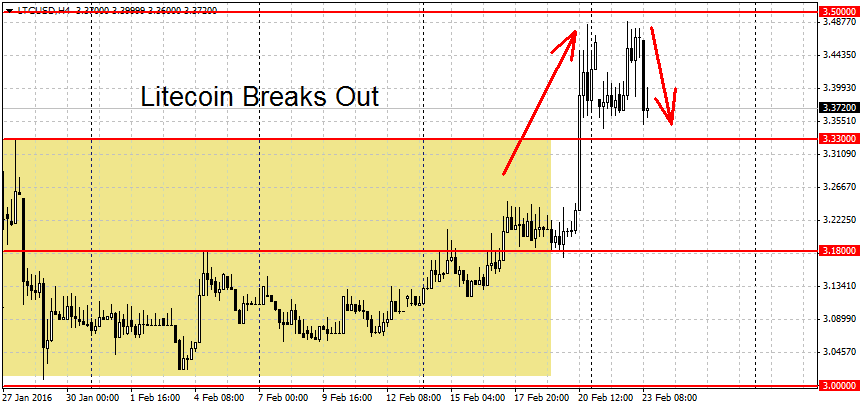
Support on the way down can be found at the breakout point of $3.33, followed by $3.25 dollars. A clean break below $3.11 would end the current rally.
On the upper end, the first strong resistance can be found at the round $3.50 level. A breakout above here could lead to extended gains toward the $3.65 dollars swing high. Higher up we have more resistance at $3.82 dollars per coin, followed by the $4.00 and $4.50 round figures. A somewhat stronger level can be found at the $4.85 spike high, the highest point for LTC/USD during last year’s bitcoin rally.
FXOpen offers the world's most popular cryptocurrency CFDs*, including Bitcoin and Ethereum. Floating spreads, 1:2 leverage — at your service. Open your trading account now or learn more about crypto CFD trading with FXOpen.
*At FXOpen UK and FXOpen AU, Cryptocurrency CFDs are only available for trading by those clients categorised as Professional clients under FCA Rules and Professional clients under ASIC Rules respectively. They are not available for trading by Retail clients.
This article represents the opinion of the Companies operating under the FXOpen brand only. It is not to be construed as an offer, solicitation, or recommendation with respect to products and services provided by the Companies operating under the FXOpen brand, nor is it to be considered financial advice.
Latest articles

Anchored VWAP and How You Can Use It in Forex Trading
In the world of forex trading, understanding the nuanced tools at your disposal can significantly enhance decision-making processes. One such sophisticated tool is the Anchored Volume-Weighted Average Price (Anchored VWAP), which refines the standard VWAP by allowing traders to set

META Share Price Collapses after Publication of Quarterly Report
Just yesterday, META's stock price closed at USD 493.50, up approximately 40% since the start of 2024 and up nearly 300% since the start of 2023.
However, following the release of Meta's quarterly report, its shares plummeted to USD

USD/JPY Analysis: The Rate Exceeds The Level of 155 Yen Per US Dollar
Today, the price of USD/JPY once again renewed its 34-year high, exceeding the level of 155 yen per dollar, which put pressure on the current authorities.
According to Reuters, officials are trying to maintain calm in the market.
"We