


FXOpen
Both bitcoin and litecoin are trading very close to where they were last week. Bitcoin is down by $25 dollars or 0.4 percent. Litecoin is trading lower by $1.04 dollars or 1.9 percent.
Bitcoin Down Only 0.4 Percent
Bitcoin prices are only lower by 0.4% percent compared to our article last week. Still BTC/USD remains in a downtrend on the daily charts. To end it we need a breakout above $6,646 dollars. A breakout above $7,705 dollars is needed for a new rally. In-between these two important levels there’s potential resistance at $6,840, $7,155 and $7,212 dollars per coin.
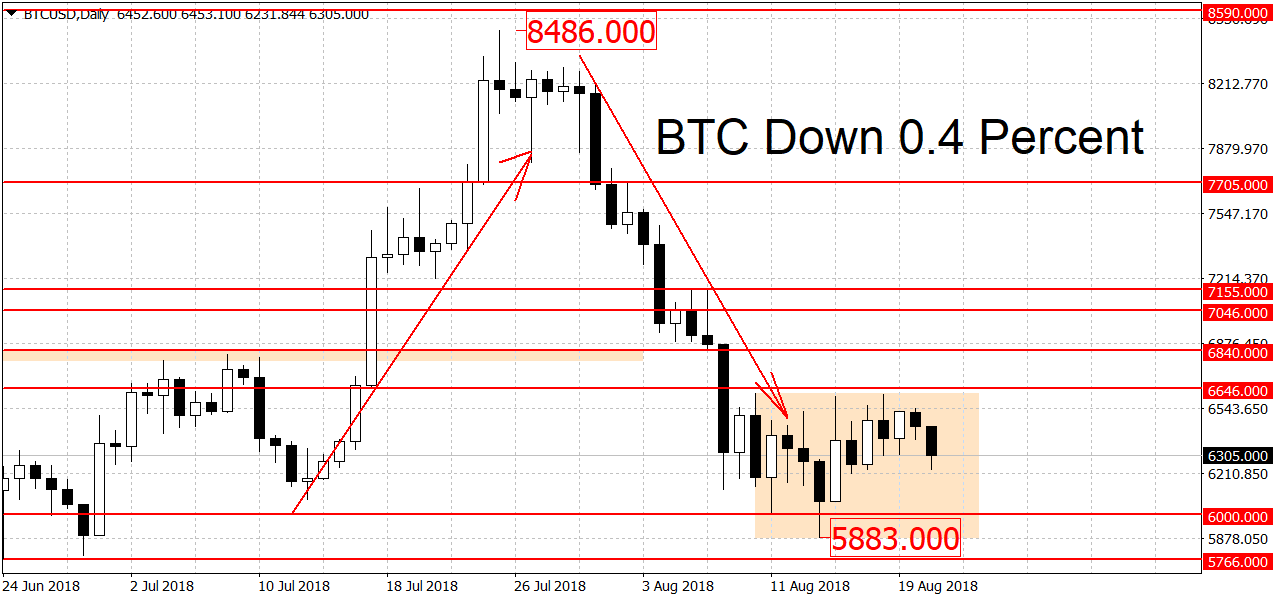
On the lower end there’s strong support in the $5,700 to $6,000 dollars area. This is a quadruple bottom for BTC/USD, with the latest test bottoming out at $5,883 dollars last week. If the bears manage to clear out this area we could see quick losses toward the $5,000 round figure.
As you can probably guess by the lack of movement during the past seven days, on the longer-term charts there is no change. The weekly chart is still bearish while the monthly is keeping a slight bullish bias.
Litecoin Trading Little Changed
Similarly to BTC, Litecoin is trading little changed. Since our last LTC update, the altcoin is down by only $1.04 or 1.9 percent.
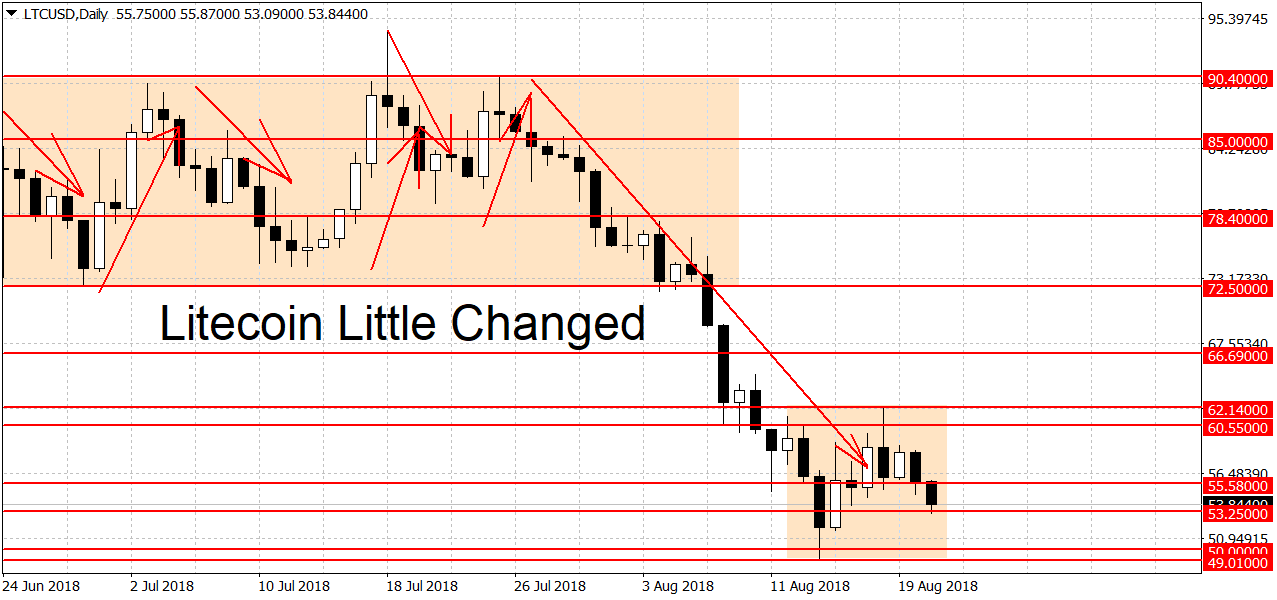
Here too the range hasn’t managed to end the downtrend yet. For that to happen we need a decisive break above the $62.14 swing high. A breakout above $78.40 dollars could start a new rally.
On the lower end there’s strong support around the $50 round figure. Last week we hit a low of $49.10 dollars before bouncing higher. This area is important because here we have the 2013 high at $48.40 dollars coupled with the $50 round figure. That 2013 high wasn’t broken until July of 2017. Because resistance turns to support, it was expected to see some buyers step in here.
However similarly to the $5,700 support in BTC, a clean break below $48.40 could completely change the picture and lead to extended losses. Both of these levels are approximately 10 percent away from the current price of BTC and LTC so they will probably get tested at the same time. For Litecoin there’s no change on the longer-term charts either. The trend is bearish on the weeklies but slightly bullish on the monthly charts.
Trade bitcoins on FXOpen Crypto accounts.
FXOpen offers the world's most popular cryptocurrency CFDs*, including Bitcoin and Ethereum. Floating spreads, 1:2 leverage — at your service. Open your trading account now or learn more about crypto CFD trading with FXOpen.
*At FXOpen UK and FXOpen AU, Cryptocurrency CFDs are only available for trading by those clients categorised as Professional clients under FCA Rules and Professional clients under ASIC Rules respectively. They are not available for trading by Retail clients.
This article represents the opinion of the Companies operating under the FXOpen brand only. It is not to be construed as an offer, solicitation, or recommendation with respect to products and services provided by the Companies operating under the FXOpen brand, nor is it to be considered financial advice.
Latest articles

Anchored VWAP and How You Can Use It in Forex Trading
In the world of forex trading, understanding the nuanced tools at your disposal can significantly enhance decision-making processes. One such sophisticated tool is the Anchored Volume-Weighted Average Price (Anchored VWAP), which refines the standard VWAP by allowing traders to set

META Share Price Collapses after Publication of Quarterly Report
Just yesterday, META's stock price closed at USD 493.50, up approximately 40% since the start of 2024 and up nearly 300% since the start of 2023.
However, following the release of Meta's quarterly report, its shares plummeted to USD

USD/JPY Analysis: The Rate Exceeds The Level of 155 Yen Per US Dollar
Today, the price of USD/JPY once again renewed its 34-year high, exceeding the level of 155 yen per dollar, which put pressure on the current authorities.
According to Reuters, officials are trying to maintain calm in the market.
"We