


FXOpen
Both bitcoin and litecoin are back in a bear market on the daily charts. One bitcoin is selling for $8,683 dollars right now while LTC is quoted at $147 dollars per coin.
Bitcoin Back in a Downtrend
As noted in our previous article, BTC/USD is now back in a bear market. Last week we saw a drop of over $1,000 dollars during which a low of $8,202 was hit. From here we got somewhat of a dead-cat bounce, helped by the Consensus conference.
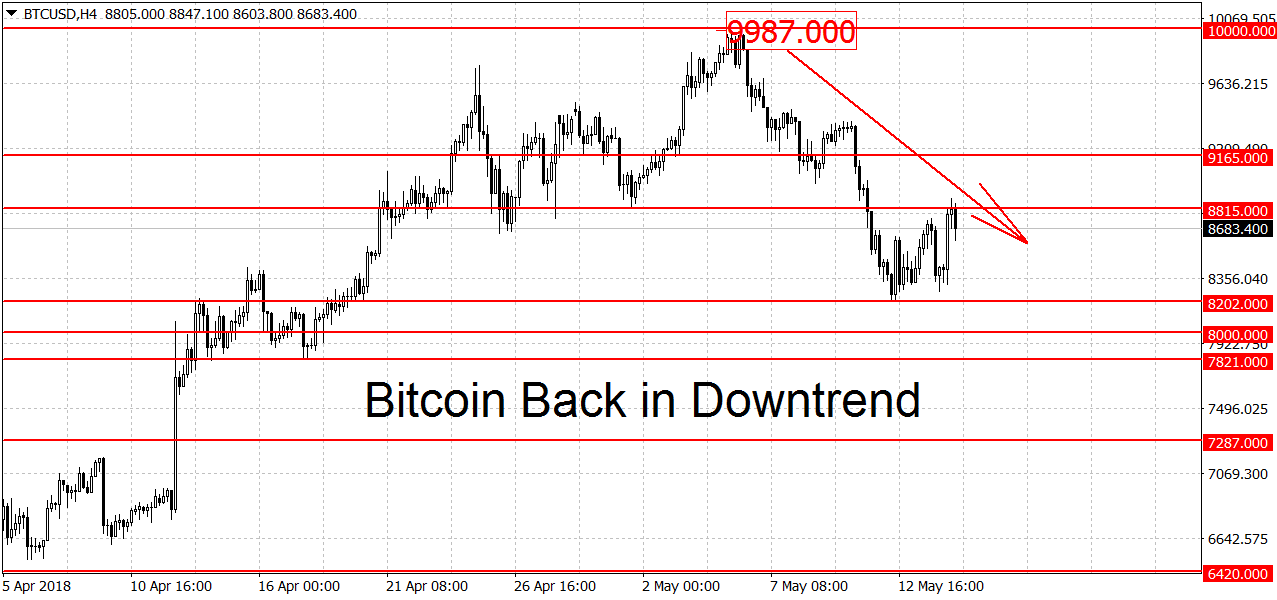
But with the event already underway and technicals turning bearish, speculators could start to ‘sell the news’. Weak support on the way down can be found at the $8,202 swing low, followed by the $8,000 round figure. Further down we have more support at $7,821, another notable swing low. A strong support area below can be found in the $6,420 to $6,600 dollars range. This is where we bottomed out during the last selloff. A decisive break below here could open the door for a break of this year’s low at $5,980 dollars.
On the upside there’s resistance at the $9,165 dollars, followed by a strong area of resistance around the $10,000 round figure. A clean breakout above here would both end the downtrend and start a new uptrend. On the longer-term weekly charts BTC/USD is in a range while the monthly chart is looking bullish.
Litecoin Back in a Bear Market
Litecoin continues to follow bitcoin down. The altcoin dropped $39 dollars last week, hitting a low of $130.77 at one point. We are currently quoted somewhat higher as the start of Consensus lifted crypto assets all around.
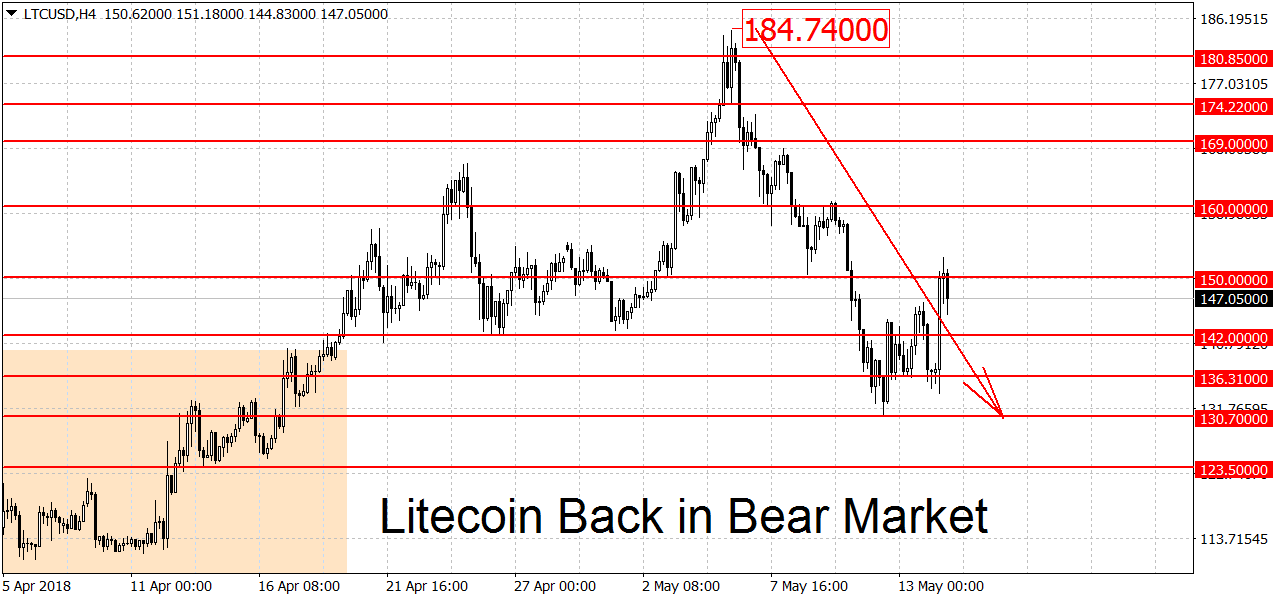
But similarly to BTC, this move will likely not last. The daily trend for LTC/USD remains bearish. To end it the bulls will have to push us above this month’s high at $184.74 dollars. Weak support below can be found at the $133.92 and $130.70 swing lows.
Further down we have more support at the $123.50 dollars followed by the the $108.44 swing low. The low for 2018 is close to here at $105.55 dollars, some traders may choose to wait until that milestone is taken out as well. Further down the $100 round figure may also act as weak support although this level is not as strong as the $105.55 – $108.44 support area. On the longer-term weekly and monthly charts LTC/USD is still looking bullish.
FXOpen offers the world's most popular cryptocurrency CFDs*, including Bitcoin and Ethereum. Floating spreads, 1:2 leverage — at your service. Open your trading account now or learn more about crypto CFD trading with FXOpen.
*At FXOpen UK and FXOpen AU, Cryptocurrency CFDs are only available for trading by those clients categorised as Professional clients under FCA Rules and Professional clients under ASIC Rules respectively. They are not available for trading by Retail clients.
This article represents the opinion of the Companies operating under the FXOpen brand only. It is not to be construed as an offer, solicitation, or recommendation with respect to products and services provided by the Companies operating under the FXOpen brand, nor is it to be considered financial advice.
Latest articles

Anchored VWAP and How You Can Use It in Forex Trading
In the world of forex trading, understanding the nuanced tools at your disposal can significantly enhance decision-making processes. One such sophisticated tool is the Anchored Volume-Weighted Average Price (Anchored VWAP), which refines the standard VWAP by allowing traders to set

META Share Price Collapses after Publication of Quarterly Report
Just yesterday, META's stock price closed at USD 493.50, up approximately 40% since the start of 2024 and up nearly 300% since the start of 2023.
However, following the release of Meta's quarterly report, its shares plummeted to USD

USD/JPY Analysis: The Rate Exceeds The Level of 155 Yen Per US Dollar
Today, the price of USD/JPY once again renewed its 34-year high, exceeding the level of 155 yen per dollar, which put pressure on the current authorities.
According to Reuters, officials are trying to maintain calm in the market.
"We