


FXOpen

BTC/USD
Last week on Monday the price of Bitcoin was sitting at $9723.8 at the open from where we’ve seen an increase of 12.11% until Friday’s high when the price reached $10901 at its highest point. From Friday’s high the price has depreciated by 6.71% to Monday’s low at $10172 and but has recovered since and is currently sitting slightly above at around $10271.
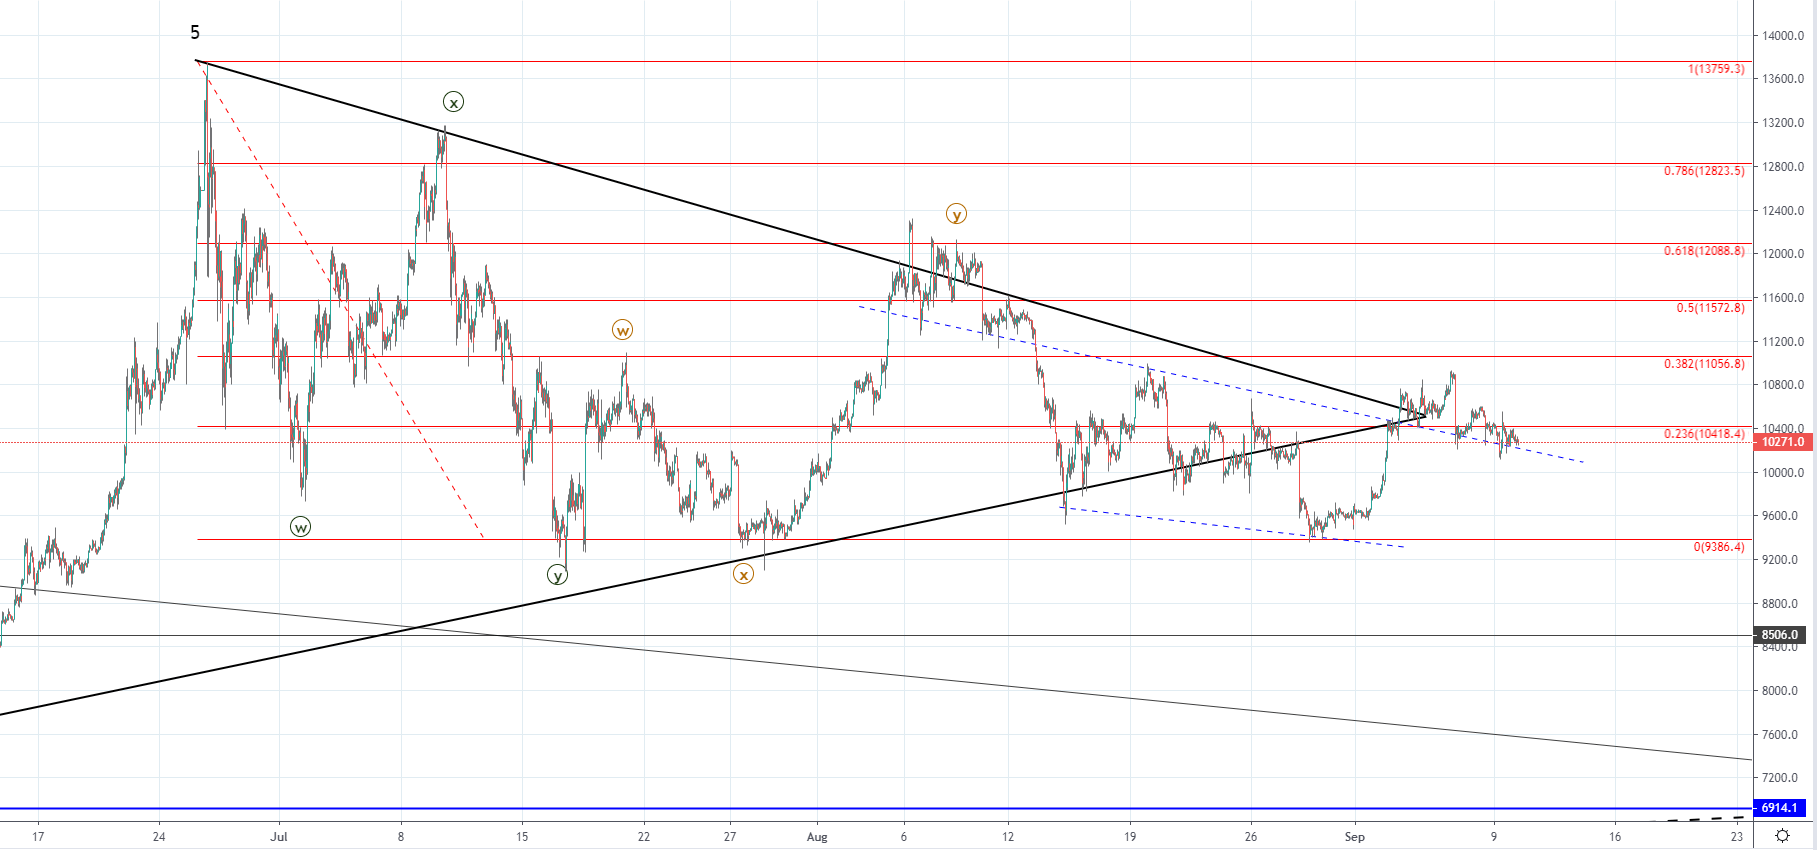 Looking at the hourly chart, you can see that the price is still above the upper descending trendline which serves as support but has fallen below the 0.236 Fibonacci level and is forming a cluster. As the interaction with the 0 Fib line ended as a retest of the support level with the price finding support an increase of over 15% occurred but this increase mighty still be corrective before we see a strong downward move, especially considering that the price came up above the symmetrical triangle's resistance level and attempted to break out to the upside but found strong resistance there and pulled back inside the triangles territory.
Since the yearly high was made we’ve seen a correction taking place inside the triangle structure and it consisted of two WXY three-wave corrections which is why after the second Y wave ended around the 0.618 Fib level the third structure is likely developing. As the third structure is likely to push the price for a lower low a breakout to the downside looks more likely but we could see the current recovery continuing for another attempt for a breakout to the upside.
XRP/USD
The price of Ripple has been stuck in a horizontal range from $0.24730 with its median line being the Monday’s low at $0.25393 and its resistance level being at $0.26617. From last Monday’s low which was an interaction with the median level we’ve seen an increase to its resistance level but another minor retracement after the interaction ended as rejection with the price currently sitting at around $0.26.
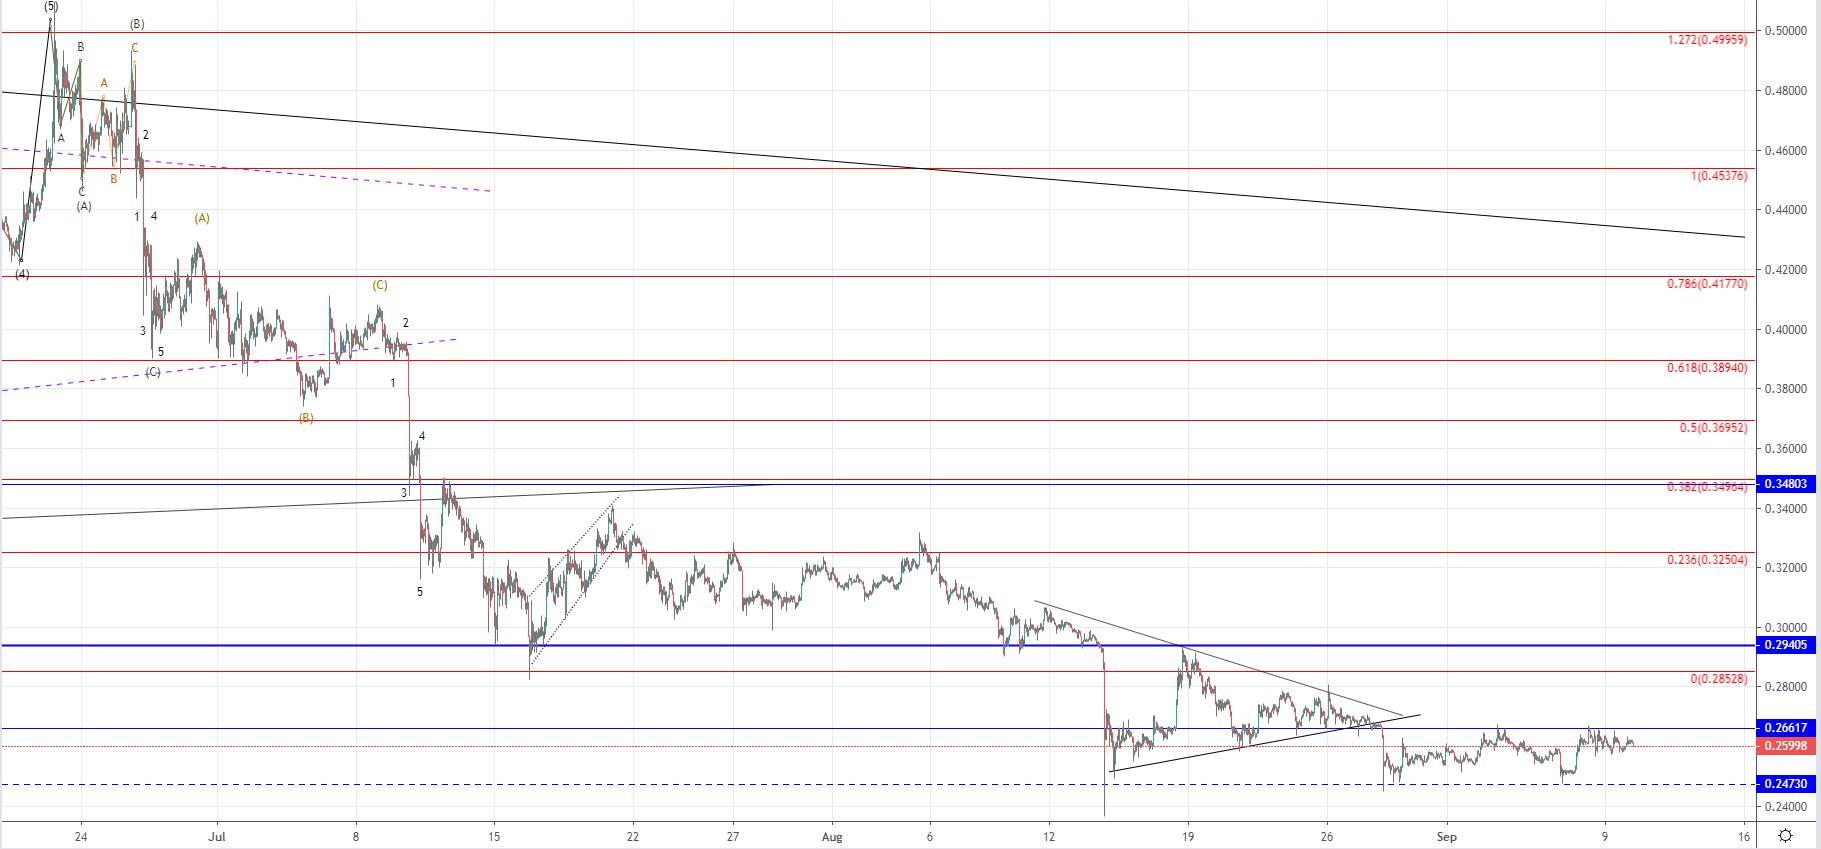 On the hourly chart, we can see that from the yearly high at around $0.5 the price of Ripple has been nothing but decreasing and has depreciated in value by slightly over 50% coming below the most significant horizontal support level at $0.29405 when it was also stuck in a horizontal range and continued to breakout to the downside. Will the same pattern develop and we are to see further downtrend continuation it is still unclear but the current horizontal range could be interpreted as a consolidative one from which recovery is to take place. A breakout from either side is going to dictate the longer-term trend development which is why the horizontal range outline levels are serving as pivot points.
FXOpen offers the world's most popular cryptocurrency CFDs*, including Bitcoin and Ethereum. Floating spreads, 1:2 leverage — at your service. Open your trading account now or learn more about crypto CFD trading with FXOpen.
*At FXOpen UK and FXOpen AU, Cryptocurrency CFDs are only available for trading by those clients categorised as Professional clients under FCA Rules and Professional clients under ASIC Rules respectively. They are not available for trading by Retail clients.
This article represents the opinion of the Companies operating under the FXOpen brand only. It is not to be construed as an offer, solicitation, or recommendation with respect to products and services provided by the Companies operating under the FXOpen brand, nor is it to be considered financial advice.
Latest from Cryptocurrencies
Latest articles

What Is a Break of Structure and How Can You Trade It?
In the ever-evolving world of Smart Money Concept (SMC) trading, a nuanced understanding of market dynamics is indispensable. This article explores the concept of Break of Structure (BOS), how to identify it, and its implications for trading strategies, setting traders
Hong Kong Stocks Become Top Risers After Wild Ride Subsides
Hong Kong enjoyed a sterling reputation for an entire century as a highly polished, utterly stable mantlepiece upon which global corporations could comfortably sit and where an international talent base could reside in fabulous surroundings and approach European, American, African

Brent Oil Price Did Not Rise Despite Iran's Attack on Israel
As you know, Iran launched a missile attack on Israel over the weekend. This could greatly increase the price of Brent oil, given that Iran is one of the top 10 oil producing countries, and the fact of the strike