


FXOpen
AUD/USD remained supported above the 0.7350 level and is currently trading higher. Similarly, NZD/USD is placed nicely in an uptrend and it could accelerate gains towards 0.6820.
Important Takeaways for AUD/USD and NZD/USD
- The Aussie Dollar remained in a bullish zone with supports near 0.7350 and 0.7370 against the US Dollar.
- There is a contracting triangle formed with resistance near 0.7395 on the hourly chart of AUD/USD.
- NZD/USD is following a major bullish trend line with current support at 0.6785 on the hourly chart.
- Today’s US NFP release for June 2018 could be a game changer for both AUD/USD and NZD/USD.
AUD/USD Technical Analysis
The Aussie Dollar formed a solid support above the 0.7300 level and recovered against the US Dollar. The AUD/USD pair climbed above the 0.7350 and 0.7370 resistance levels to move into a bullish zone.
An intermediate low was formed at 0.7361 and the pair is currently attempting an upside break above 0.7400. It is trading above the 38.2% Fib retracement level of the last decline from the 0.7424 high to 0.7361 low.
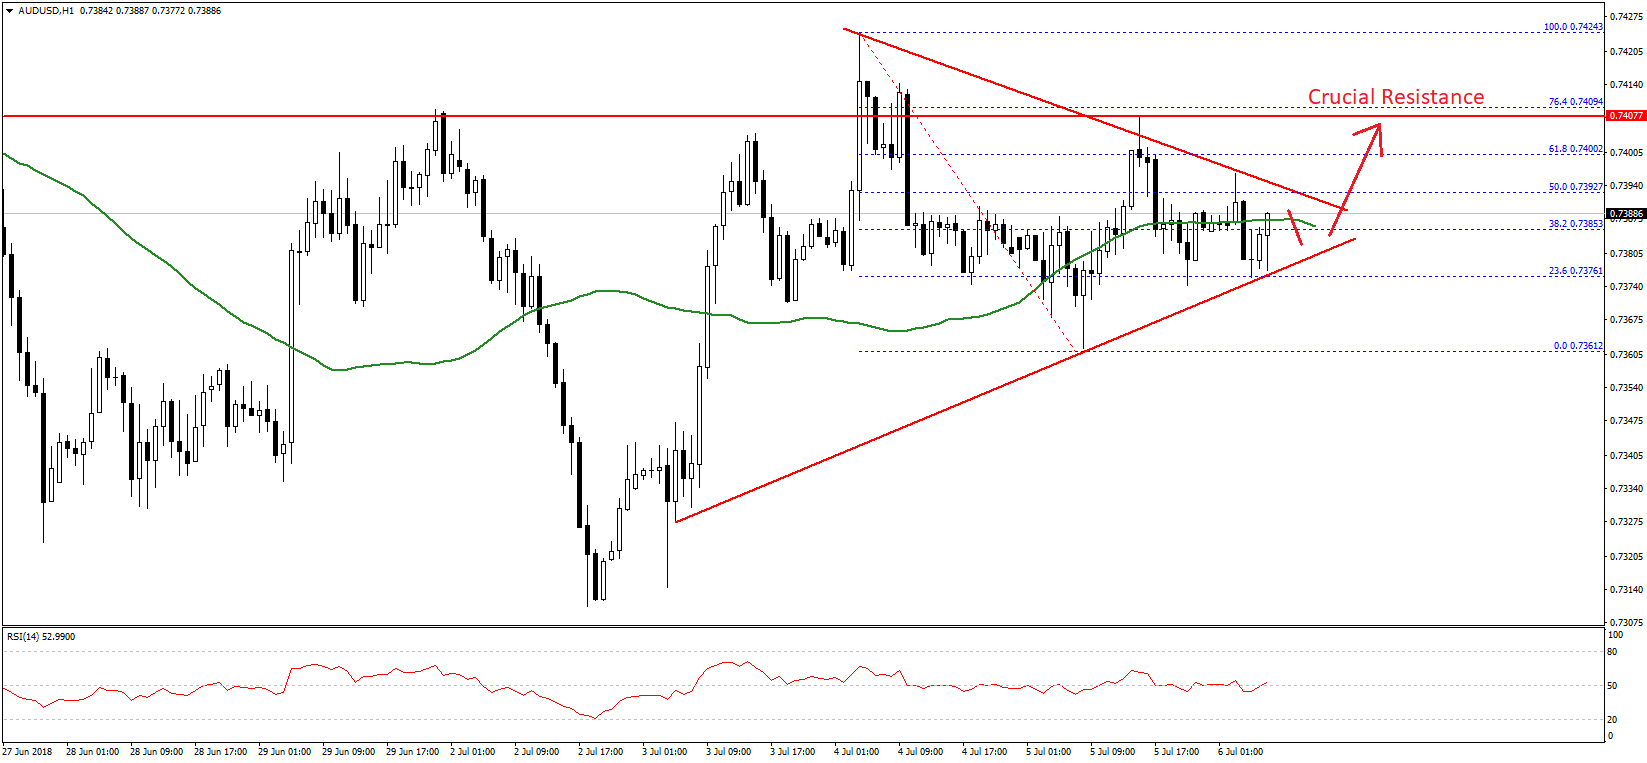
More importantly, there is a contracting triangle formed with resistance near 0.7395 on the same chart. A break above the contracting triangle could open the doors for more gains in the near term.
The next resistance is at 0.7410, which acted as a barrier earlier as well and is currently coincides with the 76.4% Fib retracement level of the last decline from the 0.7424 high to 0.7361 low.
Should there be more gains above 0.7410, the pair will most likely accelerate higher towards the 0.7450 level. On the flip side, if there is a downside break below the triangle support at 0.7380, the pair may perhaps revisit the 0.7360 swing low. Below 0.7360, the pair might move into a bearish zone towards the 0.7320 level.
NZD/USD Technical Analysis
The New Zealand Dollar started a solid uptrend after it formed a support base near 0.6700 against the US Dollar. The NZD/USD pair traded above the 0.6720 and 0.6750 resistance levels to place itself in a buy zone.
It is currently trading well above the last swing high at 0.6780, the 50 hourly simple moving average, and the 0.6770 pivot level. An immediate resistance is near 0.6810, which is the 1.236 Fib extension level of the last decline from the 0.6789 high to 0.6687 low.
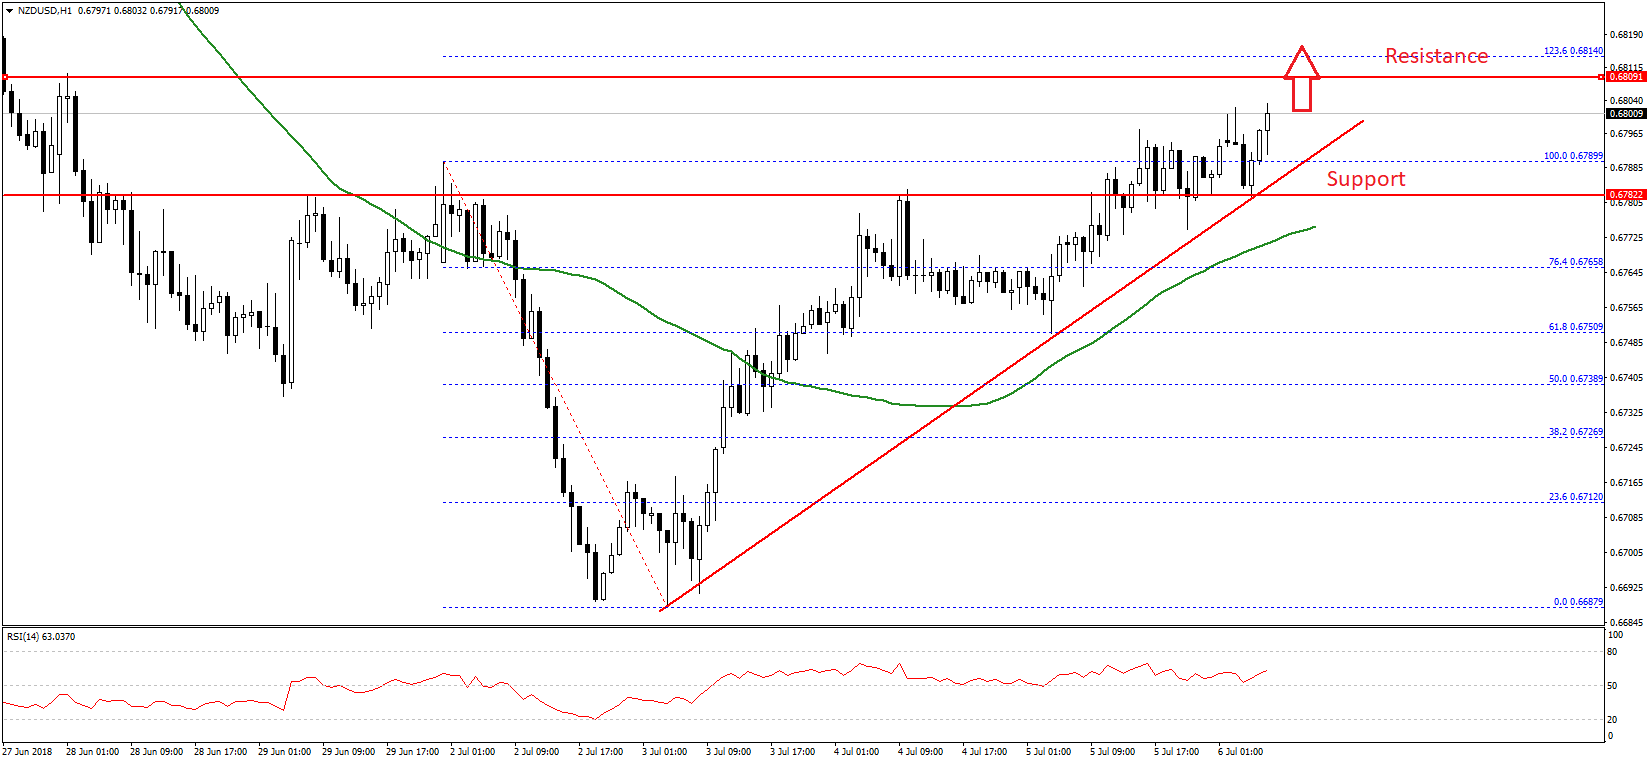
A break and close above the 0.6800-10 resistance area could push the pair towards the 0.6850 resistance. On the downside, there is a key bullish trend line in place with current support at 0.6785 on the hourly chart.
Should the pair break the trend line support, it may test the 50 hourly SMA at 0.6770. Below this, there is a risk of more declines towards the 0.6750 support.
Fundamentally, there is a high risk even scheduled in the US today, as the Nonfarm payrolls report for June 2018 will be released. The forecast is slated for 195K, down from the last 223K. If the actual exceeds the forecast, there could be a downside correction in AUD/USD and NZD/USD.
On the other hand, if the actual figure is below 150K, the US Dollar may face selling pressure in the short term.
Trade over 50 forex markets 24 hours a day with FXOpen. Take advantage of low commissions, deep liquidity, and spreads from 0.0 pips. Open your FXOpen account now or learn more about trading forex with FXOpen.
This article represents the opinion of the Companies operating under the FXOpen brand only. It is not to be construed as an offer, solicitation, or recommendation with respect to products and services provided by the Companies operating under the FXOpen brand, nor is it to be considered financial advice.
Latest from Forex Analysis
Latest articles

Google Share Price Rose Post-market to a New All-time Record
Yesterday, after the close of the main trading session, a report on activities for the 1st quarter of Alphabet Inc. (Google's parent company) was published. The report was strong, exceeding investors' expectations.
→ Quarterly EPS = USD 1.89 (expected = USD 1.

S&P 500 Rebounds after Negative GDP News
Data released yesterday showed US GDP growth slowed to 1.6% in the first quarter of the year. According to ForexFactory: forecast = 2.2%, past value = 2.4%.
Reaction to the news sent the S&P 500 mini stock

GBP/USD And USD/CAD Daily Chart Outlook
GBP/USD is attempting a recovery wave from 1.2300. USD/CAD is consolidating and might aim for a move above the 1.3760 resistance zone.
Important Takeaways for GBP/USD and USD/CAD Analysis Today
· The British Pound started