


FXOpen

AUD/USD remained well bid above the 0.7250 support, but it is facing hurdles near 0.7350. Conversely, NZD/USD broke a major barrier at 0.6750 and it is currently rising steadily.
Important Takeaways for AUD/USD and NZD/USD
- The Aussie Dollar is trading in a broad range above the 0.7250 support against the US Dollar.
- There is a connecting bearish trend line forming with resistance near 0.7330 on the hourly chart of AUD/USD.
- NZD/USD broke the 0.6750 resistance zone and it is gaining bullish momentum.
- There is a key rising channel forming with support near 0.6700 on the hourly chart of NZD/USD.
AUD/USD Technical Analysis
The Aussie Dollar seems to be following a broad range above the 0.7250 support level against the US Dollar. The AUD/USD pair traded as low as 0.7254 on FXOpen recently and it is currently moving higher.
There was a break above the 0.7280 and 0.7300 resistance levels. The pair traded nicely above the 50% Fib retracement level of the downward move from the 0.7344 high to 0.7254 low.
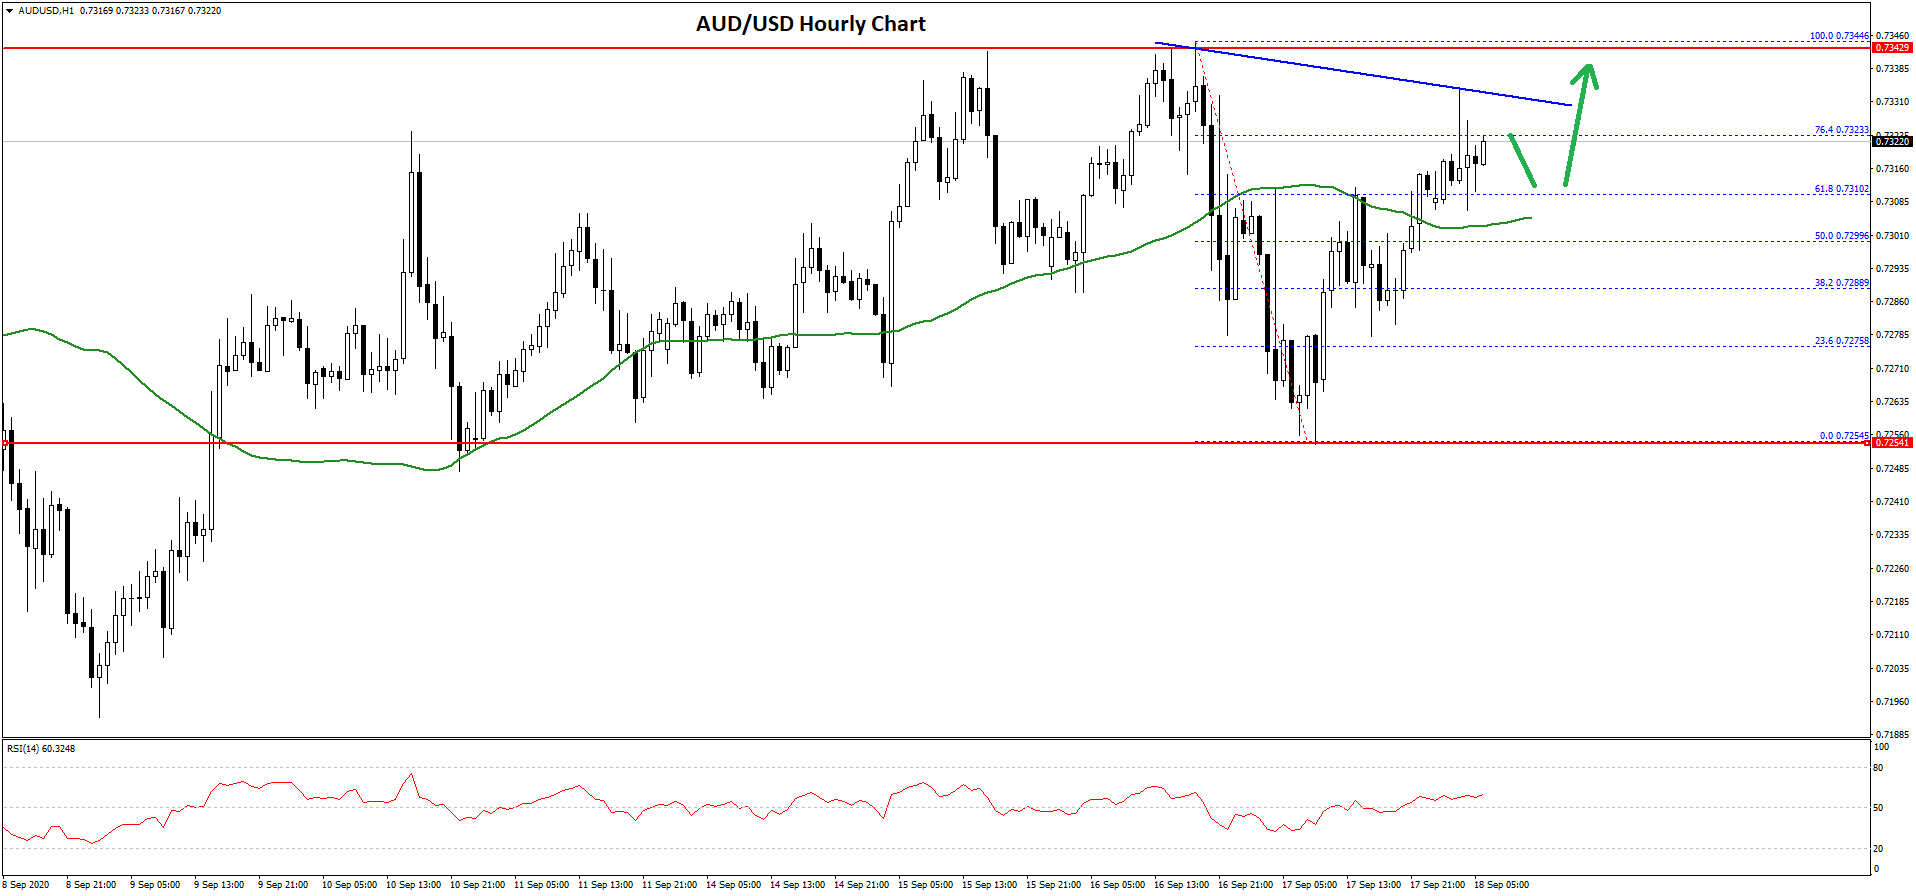
Moreover, there was a close above the 0.7300 level and the 50 hourly simple moving average. However, the pair is facing a lot of hurdles on the upside, starting with 0.7330. There is also a connecting bearish trend line forming with resistance near 0.7330 on the hourly chart of AUD/USD.
The pair is currently testing the 76.4% Fib retracement level of the downward move from the 0.7344 high to 0.7254 low. The main resistance on the upside is near the range high at 0.7350.
If there is an upside break above the trend line and the 0.7350 resistance, there are chances of a steady rise. The next key resistance on the upside is near the 0.7400 level. Conversely, the pair might start a fresh decline below the 0.7300 level.
The first key support is near the 0.7280 level. The main support is still near the 0.7250 level, below which AUD/USD might accelerate its losses towards the 0.7200 support in the near term.
NZD/USD Technical Analysis
The New Zealand Dollar started a strong increase from the 0.6600 support zone against the US Dollar. The NZD/USD pair traded higher and broke many hurdles near the 0.6700 level.
Recently, the pair surpassed a major hurdle near the 0.6750 level to move further into a positive zone. There was also a close above the 0.6750 level and the pair settled well above the 50 hourly simple moving average.
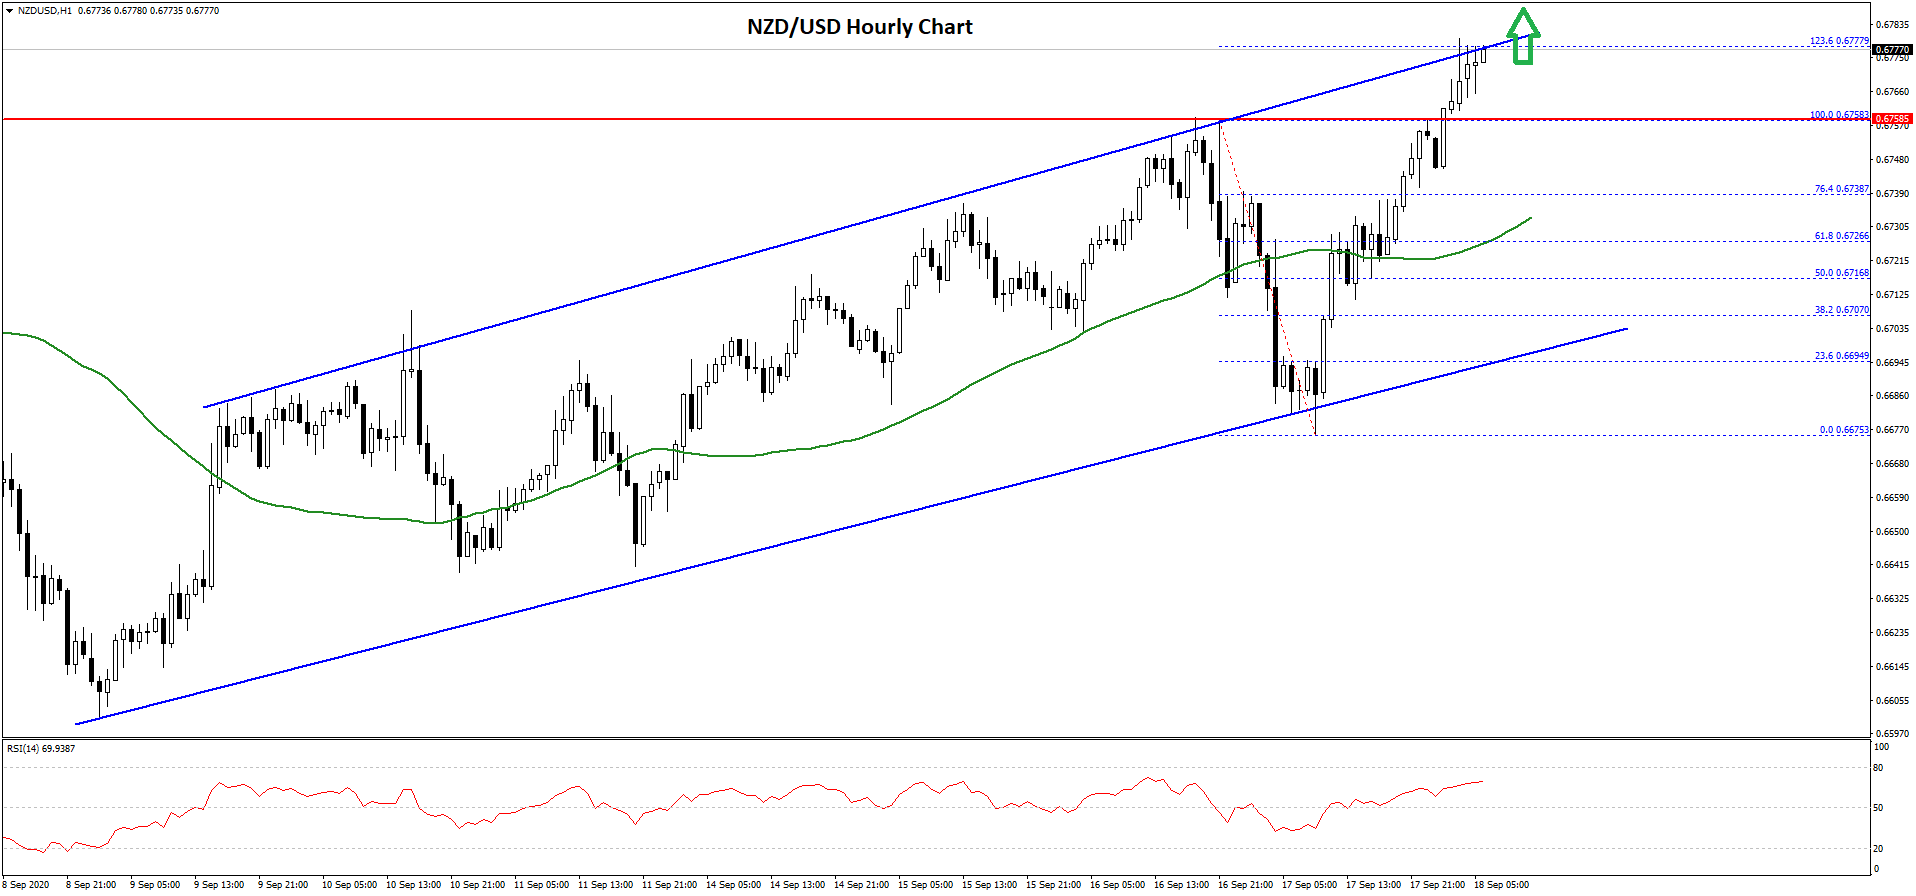
The pair is now testing the 1.236 Fib extension level of the downward move from the 0.6758 high to 0.6675 low. Moreover, there is also a key rising channel forming with support near 0.6700 on the hourly chart of NZD/USD.
The channel resistance is close to the 0.6775 resistance. It seems like the pair is setting up for an upside break above the channel resistance and 0.6780.
The next major resistance is near the 0.6800 level, above which it could test the 1.618 Fib extension level of the downward move from the 0.6758 high to 0.6675 low at 0.6810. Conversely, the pair could correct lower from the channel resistance.
The first major support is near the 0.6750 level (the breakout zone). Any further losses may perhaps lead the pair towards the channel support zone near the 0.6700 level.
Trade over 50 forex markets 24 hours a day with FXOpen. Take advantage of low commissions, deep liquidity, and spreads from 0.0 pips. Open your FXOpen account now or learn more about trading forex with FXOpen.
This article represents the opinion of the Companies operating under the FXOpen brand only. It is not to be construed as an offer, solicitation, or recommendation with respect to products and services provided by the Companies operating under the FXOpen brand, nor is it to be considered financial advice.
Latest from Forex Analysis
Latest articles

The Price of Gold XAU/USD Shows Strongest Fall in Almost 2 Years
On Monday, the price of gold fell from USD 2,386 to USD 2,333 per ounce — this is the strongest drop in one day in almost 2 years, according to Bloomberg. On Tuesday morning in the Asian session, the

Hong Kong-listed Chinese Insurer Goes on Rally as Western Giants Retract
The Asia Pacific region has once again become an area of great interest to investors and traders as some remarkable patterns of volatility have begun to make their presence felt.
This morning, a few examples of Hong Kong-listed Chinese companies

Bitcoin Price Bullish after Halving-2024
On April 19, 2024, a halving occurred in the Bitcoin network, resulting in the reward for the mined block amounting to 3.125 BTC.
Historically, after the halving (which is associated with a reduction in supply), the price of Bitcoin