


FXOpen

AUD/USD started a major decline after it failed to clear the 0.7765 resistance. NZD/USD also declined and it broke a major support near the 0.7200 zone.
Important Takeaways for AUD/USD and NZD/USD
- The Aussie Dollar started a fresh decline below the 0.7740 and 0.7700 support levels against the US Dollar.
- There was a break below a major bullish trend line with support near 0.7730 on the hourly chart of AUD/USD.
- NZD/USD also declined heavily below the 0.7200 and 0.7180 support levels.
- There is a key bearish trend line forming with resistance near 0.7200 on the hourly chart of NZD/USD.
AUD/USD Technical Analysis
Recently, the Aussie Dollar made a few attempts to clear the 0.7765 resistance zone against the US Dollar. The AUD/USD pair failed to gain momentum and it started a major decline below 0.7750.
It broke the 0.7700 support level and settled well below the 50 hourly simple moving average. The pair even broke the 0.7675 support level and extended its decline. It traded as low as 0.7644 on FXOpen and it is currently consolidating losses.
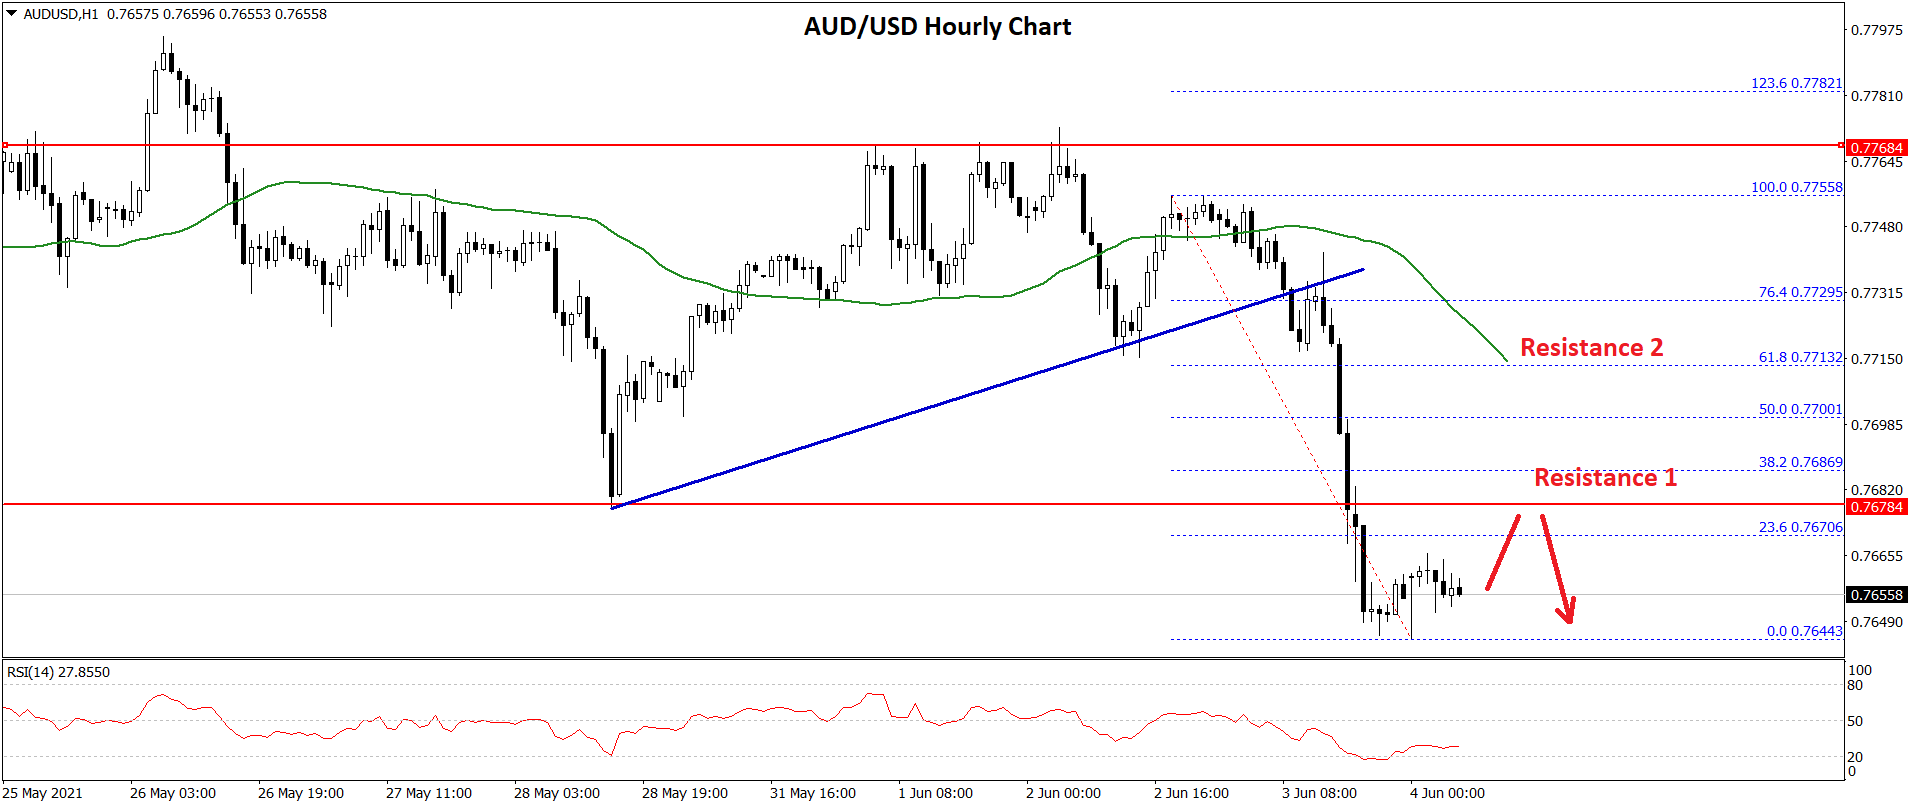
An initial resistance on the upside is near the 0.7670 level. It is near the 23.6% Fib retracement level of the recent decline from the 0.7755 high to 0.7644 low.
The first major resistance is near the 0.7675 level (the recent breakdown zone). The next major resistance is near the 0.7700 level. It is close to the 50% Fib retracement level of the recent decline from the 0.7755 high to 0.7644 low.
Any more gains could lead the pair towards the 0.7715 level and the 50 hourly simple moving average. Conversely, the pair could further decline below the 0.7650 support zone.
The next major support is near the 0.7640 level. If there is a downside break below the 0.7640 level, the pair could extend its decline towards the 0.7580 level.
NZD/USD Technical Analysis
The New Zealand Dollar also followed a similar path and declined after it failed to clear the 0.7280 resistance against the US Dollar. The NZD/USD pair broke the 0.7220 support zone to move into a short-term bearish zone.
There was a break below the 0.7200 support zone and the 50 hourly simple moving average. The pair even broke 0.7150 and tested the 0.7125 support zone.
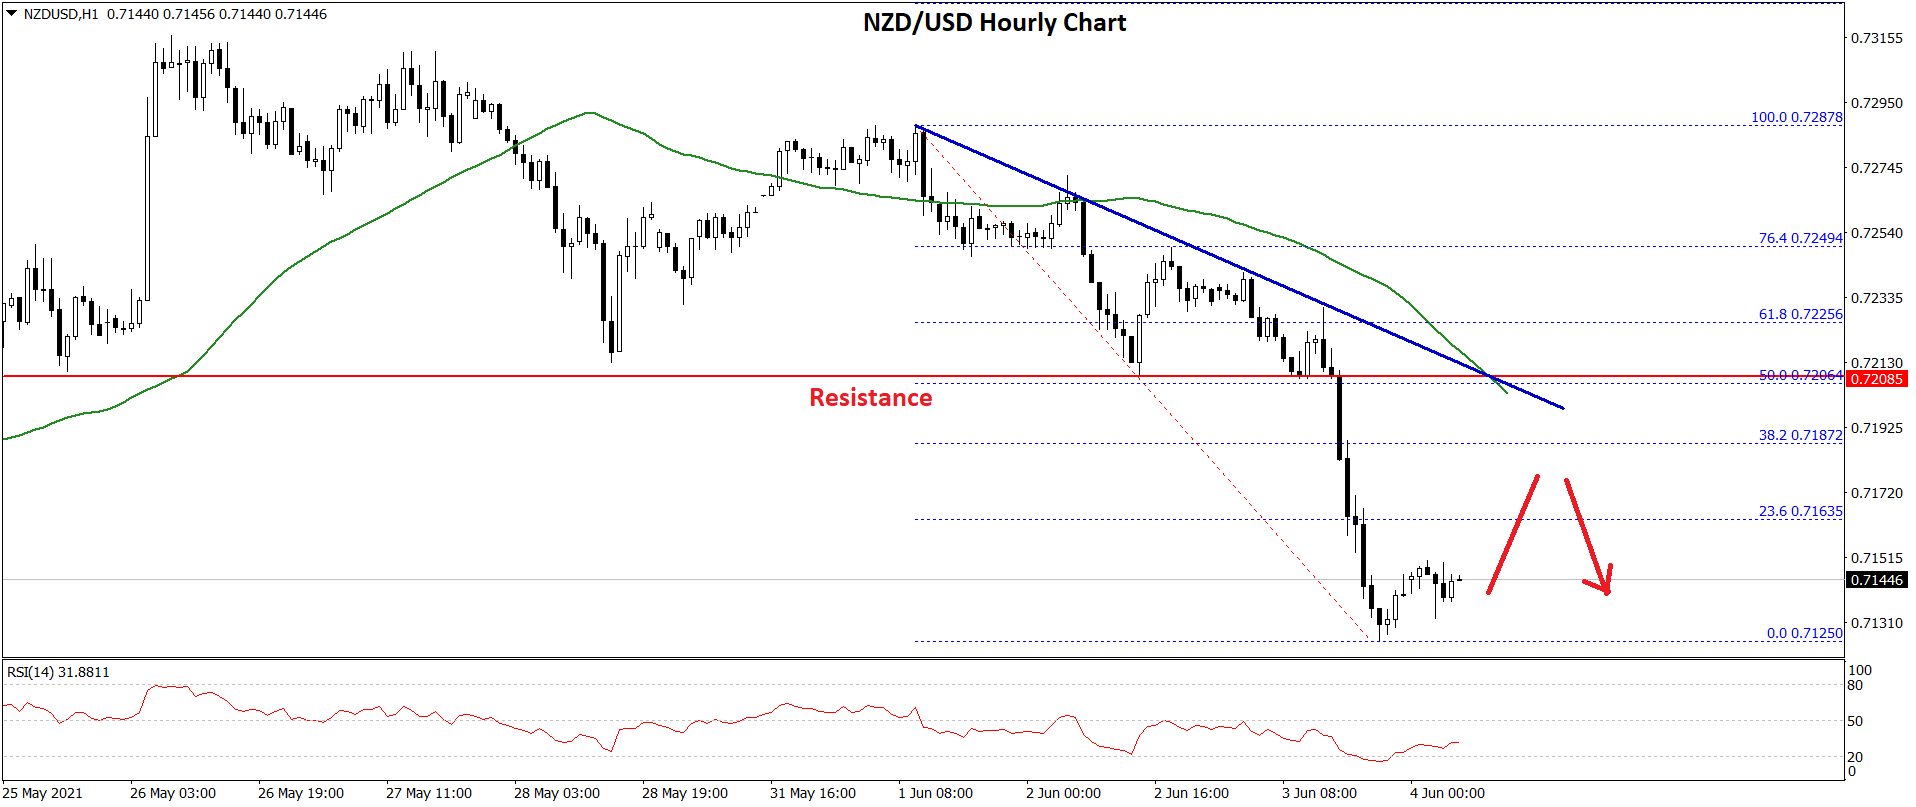
A low is formed near 0.7125 and the pair is now consolidating losses. An initial resistance is near the 0.7165 level. It is near the 23.6% Fib retracement level of the recent decline from the 0.7287 high to 0.7125 low.
The first major resistance for the bulls is near the 0.7200 level. and the 50 hourly simple moving average. There is also a key bearish trend line forming with resistance near 0.7200 on the hourly chart of NZD/USD.
The trend line is close to the 50% Fib retracement level of the recent decline from the 0.7287 high to 0.7125 low. A clear upside break above the trend line resistance and the 50 hourly SMA could open the doors for a decent increase towards the 0.7250 level. The next major resistance is near the 0.7280 level.
Conversely, the pair could extend its decline low the 0.7125 support. If NZD/USD breaks the 0.7125 low, it is likely to decline towards the 0.7080 level.
This forecast represents FXOpen Markets Limited opinion only, it should not be construed as an offer, invitation or recommendation in respect to FXOpen Markets Limited products and services or as financial advice.
Trade over 50 forex markets 24 hours a day with FXOpen. Take advantage of low commissions, deep liquidity, and spreads from 0.0 pips. Open your FXOpen account now or learn more about trading forex with FXOpen.
This article represents the opinion of the Companies operating under the FXOpen brand only. It is not to be construed as an offer, solicitation, or recommendation with respect to products and services provided by the Companies operating under the FXOpen brand, nor is it to be considered financial advice.
Latest from Forex Analysis
Latest articles

What Is a Darvas Box Theory and How Does It Work in Trading?
The Darvas Box Theory, pioneered by Nicolas Darvas in the 1950s, has transcended its stock market origins to become a valuable tool for forex traders. This method leverages specific price movements and patterns, known as the Darvas Box, to track

NFLX Stock Price Falls Despite Subscriber Growth
Yesterday, after the close of the main trading session on the stock market, Netflix reported to investors for the 1st quarter of 2024.
The report turned out better than expected:
→ earnings per share: actual = USD 5.28, forecast = USD 4.

Escalation Between Iran and Israel: How the Price of Brent Oil Reacts
On the night of Thursday into Friday, reports emerged that Israel had attacked Iran following Iran's attack on Israel over the weekend.
Let's remember that we wrote on Monday that after a 300 drone and missile attack on Israel over