


FXOpen

AUD/USD started a fresh decline from the 0.7250 resistance and broke the 0.7120 support. NZD/USD is also declining and it is showing bearish signs below 0.6600.
Important Takeaways for AUD/USD and NZD/USD
- The Aussie Dollar traded below the 0.7200 and 0.7150 support levels against the US Dollar.
- There is a key bearish trend line forming with resistance near 0.7140 on the hourly chart of AUD/USD.
- NZD/USD declined sharply after it failed to surpass the 0.6680 resistance zone.
- There is a short-term bearish trend line forming with resistance near 0.6600 on the hourly chart of NZD/USD.
AUD/USD Technical Analysis
This past week, the Aussie Dollar remained in a positive zone above 0.7200 against the US Dollar. However, the AUD/USD pair failed to clear the 0.7250 resistance zone.
As a result, there was a bearish reaction and the pair started a fresh decline below the 0.7200 support level. There was a steady decline below the 0.7150 support level. The pair even broke the 0.7120 support and settled below the 50 hourly simple moving average.
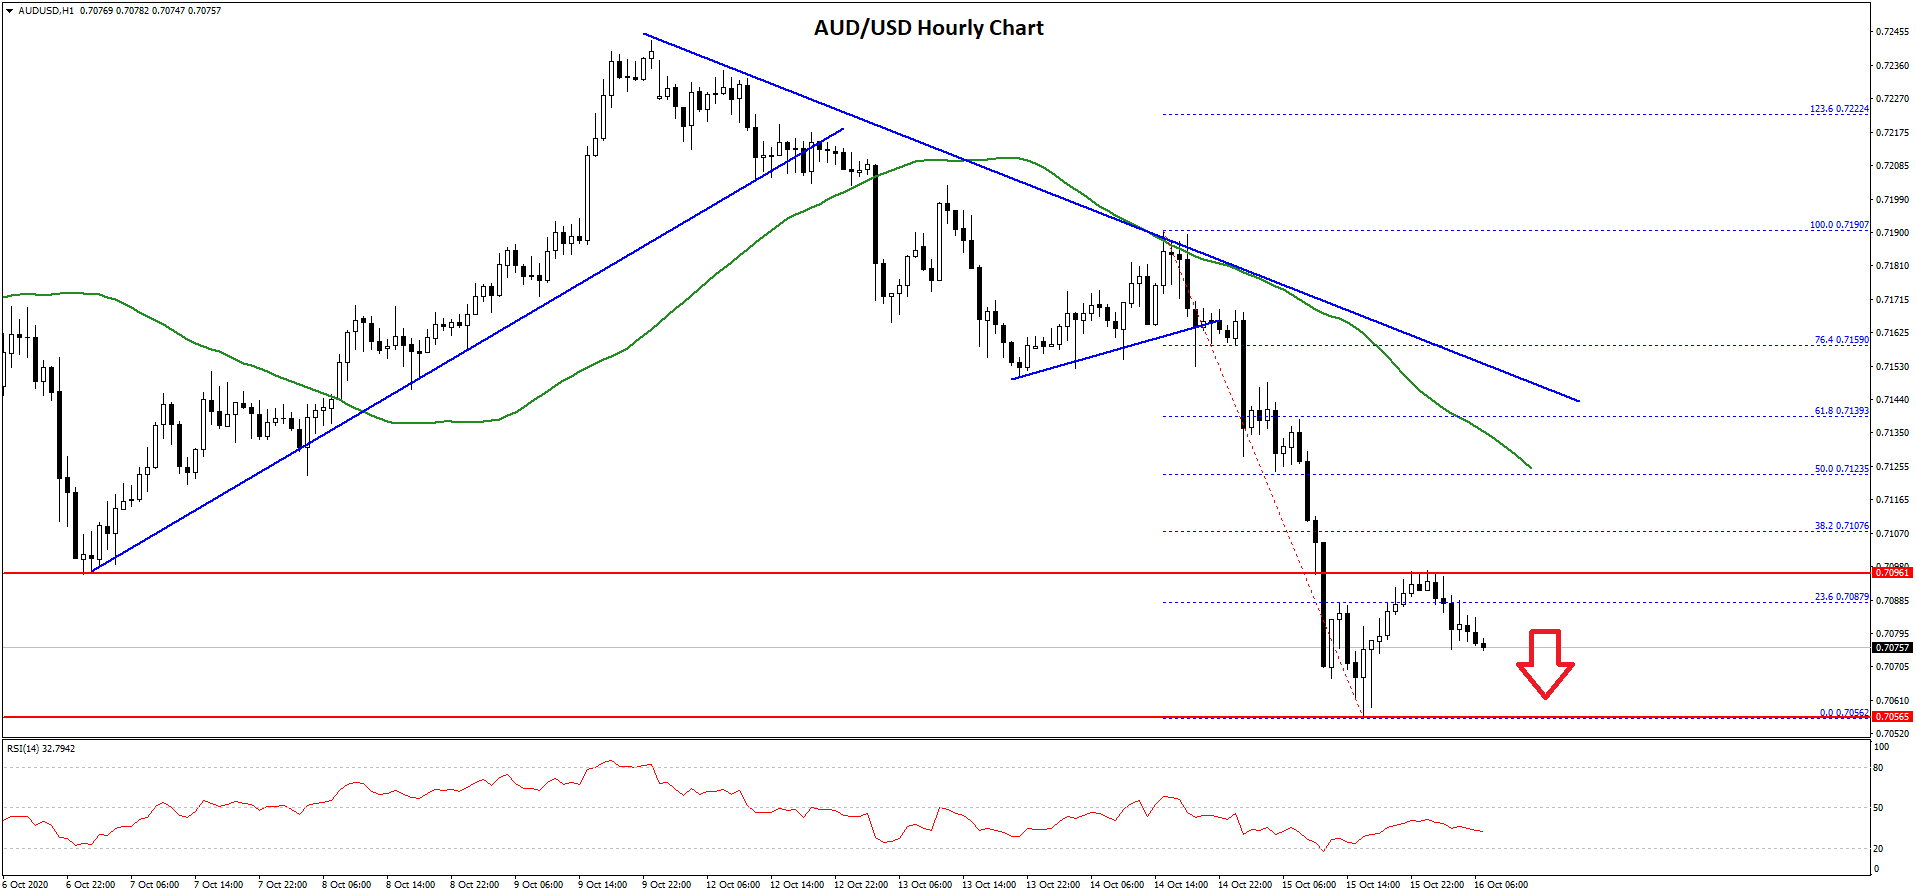
A low is formed near 0.7056 on FXOpen recently and it is currently correcting higher. There was a break above the 0.7080 level, but it struggled to gain momentum above the 23.6% Fib retracement level of the recent decline from the 0.7190 high to 0.7056 low.
On the upside, there are many hurdles forming near 0.7100 and 0.7120. The 50% Fib retracement level of the recent decline from the 0.7190 high to 0.7056 low is also near 0.7120.
Moreover, there is a key bearish trend line forming with resistance near 0.7140 on the hourly chart of AUD/USD. On the downside, the 0.7060 and 0.7050 are immediate support levels. Any further losses may perhaps open the doors for more losses towards the 0.7020 and 0.7000 support levels in the near term.
NZD/USD Technical Analysis
The New Zealand Dollar also followed a similar pattern and started a fresh decline after it failed to gain strength above 0.6680 against the US Dollar. The NZD/USD pair broke the 0.6650 support level to move into a bearish zone.
The decline gained pace below 0.6640 and the 50 hourly simple moving average. It even spiked below the 0.6600 support and traded as low as 0.6576.
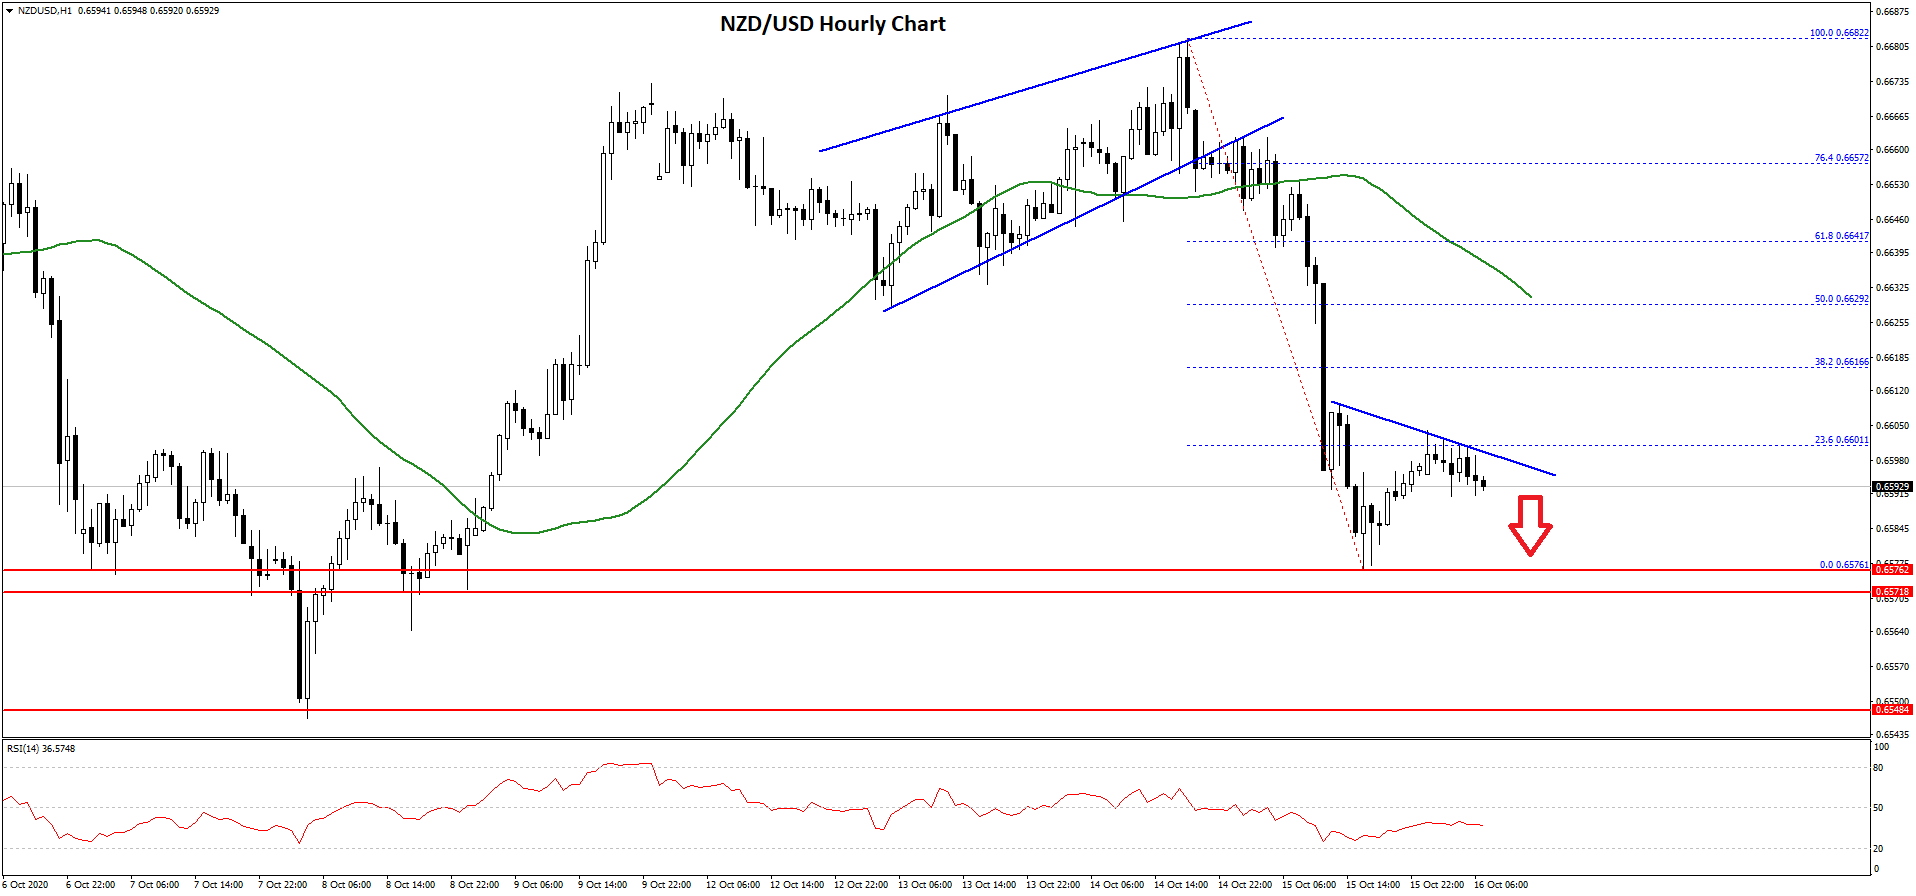
The pair is currently correcting higher above 0.6590. However, it is facing hurdles near 0.6600, and the 23.6% Fib retracement level of the recent decline from the 0.6682 high to 0.6576 low. There is also a short-term bearish trend line forming with resistance near 0.6600 on the hourly chart of NZD/USD.
A clear break above the trend line resistance is needed for a push towards the 0.6620 resistance. The next resistance is near the 0.6630 level or the 50 hourly simple moving average.
The 50% Fib retracement level of the recent decline from the 0.6682 high to 0.6576 low is also near 0.6630. If there is no upside break above 0.6600 or 0.6620, the pair is likely to continue lower.
An initial support is near the 0.6575 level. A clear break below the 0.6575 support could lead the NZD/USD pair towards the 0.6550 support. The next major support is near the 0.6520 level, below which it could test the 0.6500 zone.
Trade over 50 forex markets 24 hours a day with FXOpen. Take advantage of low commissions, deep liquidity, and spreads from 0.0 pips. Open your FXOpen account now or learn more about trading forex with FXOpen.
This article represents the opinion of the Companies operating under the FXOpen brand only. It is not to be construed as an offer, solicitation, or recommendation with respect to products and services provided by the Companies operating under the FXOpen brand, nor is it to be considered financial advice.
Stay ahead of the market!
Subscribe now to our mailing list and receive the latest market news and insights delivered directly to your inbox.


Latest articles


XBR/USD Chart Analysis: Price Rebounds from a Seven-Week Low
On 1 December, we outlined a descending channel on the XBR/USD chart and noted that the bearish trend was driven by fading geopolitical risks. Indeed, hopes for an end to the war in Ukraine—along with the possibility of

Silver Price Hits Historic Record Around $64
On 27 November, we suggested that silver was preparing to challenge its all-time high. Since then (marked with the orange arrow), XAG/USD has risen by roughly 18%, breaking above the psychological $60-per-ounce threshold for the first time in history.