


FXOpen

AUD/USD started a strong increase from the 0.6840 support and it climbed above the 0.6900 resistance. NZD/USD is also climbing higher and it is trading nicely above the 0.6600 resistance area.
Important Takeaways for AUD/USD and NZD/USD
- The Aussie Dollar is trading in a bullish zone above the 0.6900 resistance against the US Dollar.
- There is a major bullish trend line forming with support near 0.6910 on the hourly chart of AUD/USD.
- NZD/USD is showing positive signs and it is placed nicely above the 0.6600 area.
- Earlier, there was a break above a bullish flag pattern with resistance near 0.6595 on the hourly chart of NZD/USD.
AUD/USD Technical Analysis
In the past few days, there was a steady recovery in the Aussie Dollar from well below the 0.6840 level against the US Dollar. The AUD/USD pair broke a couple of important resistances near 0.6850 to enter a positive zone.
The upward move was such that the pair even climbed above the 0.6900 resistance and settled above the 50 hourly simple moving average. Finally, the pair traded as high as 0.6938 and it is currently correcting lower.
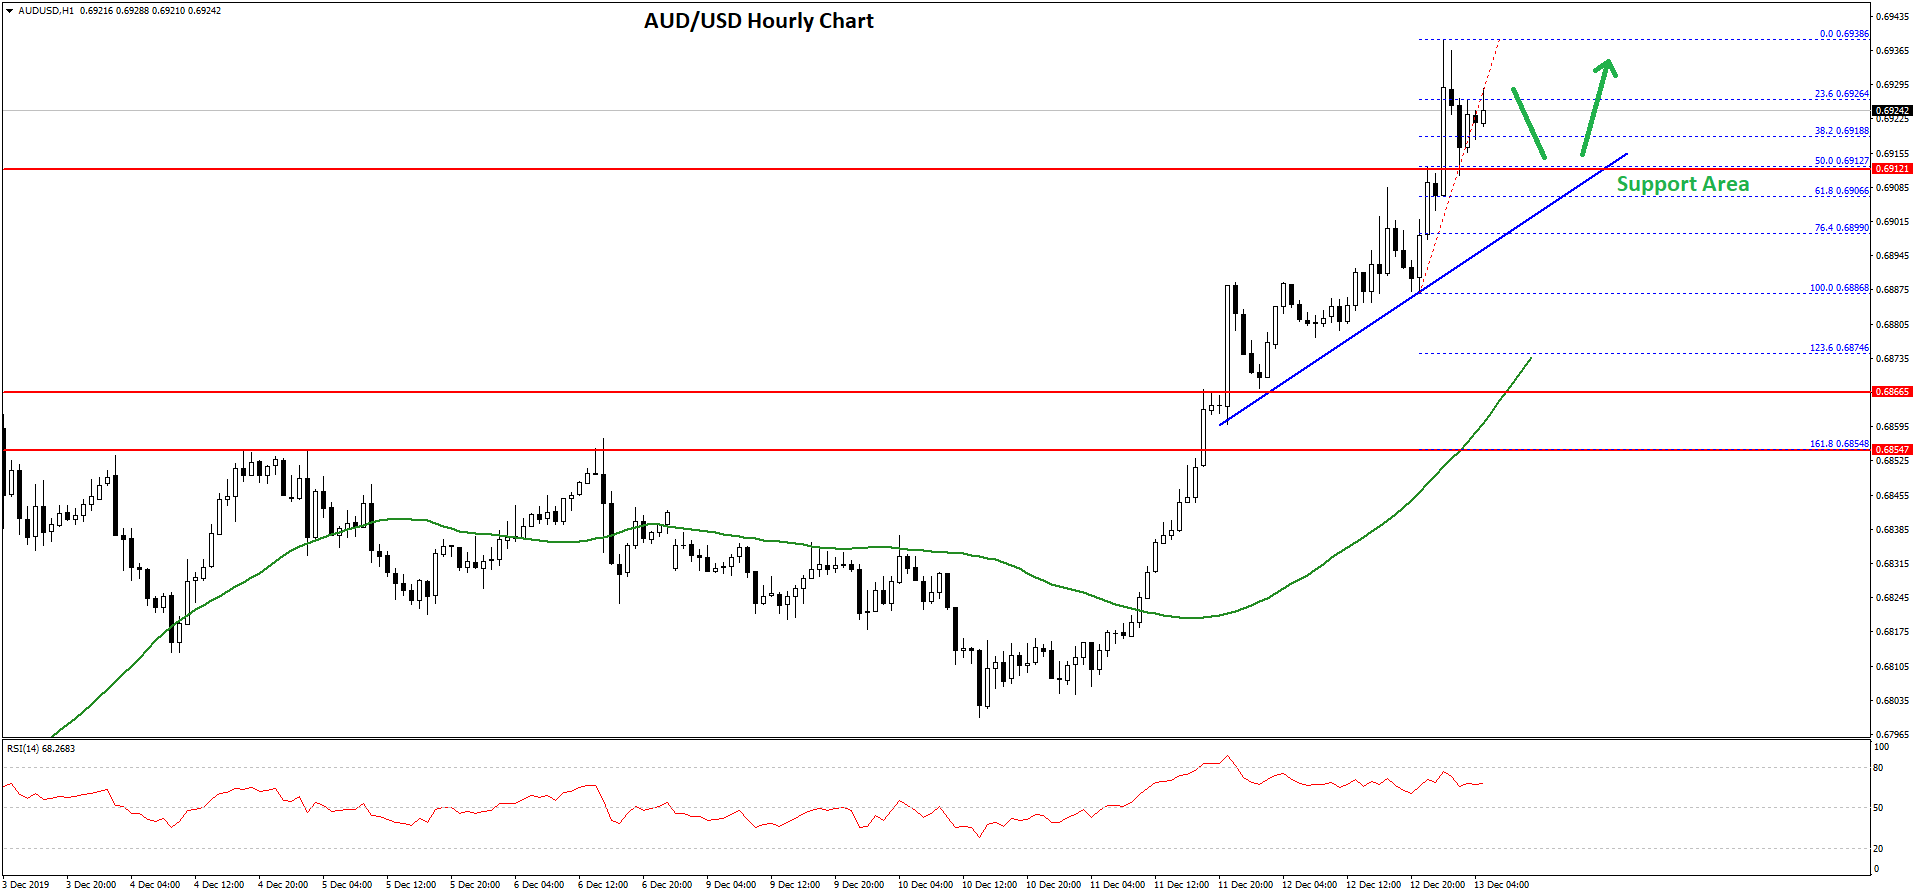
It broke the 23.6% Fib retracement level of the recent wave from the 0.6886 low to 0.6938 high. However, the 0.6910 support is acting as a strong buy zone.
Moreover, there is a major bullish trend line forming with support near 0.6910 on the hourly chart of AUD/USD. The 50% Fib retracement level of the recent wave from the 0.6886 low to 0.6938 high is also near the 0.6910 level.
Therefore, a downside break below the 0.6910 support might start a substantial downside correction. The next support is near the 0.6900 level. However, the main support could be 0.6875 and the 50 hourly simple moving average.
On the upside, an initial resistance is near the 0.6935 and 0.6940 levels. A successful break above the 0.6940 resistance area could start a strong upward move in the coming sessions towards 0.7000.
NZD/USD Technical Analysis
The New Zealand Dollar also followed a bullish path from the 0.6525 support area against the US Dollar. The NZD/USD pair broke a few key resistances near 0.6575 to enter a positive zone.
Moreover, the pair settled above the 0.6600 level and the 50 hourly simple moving average. More importantly, there was a break above a bullish flag pattern with resistance near 0.6595 on the hourly chart of NZD/USD.
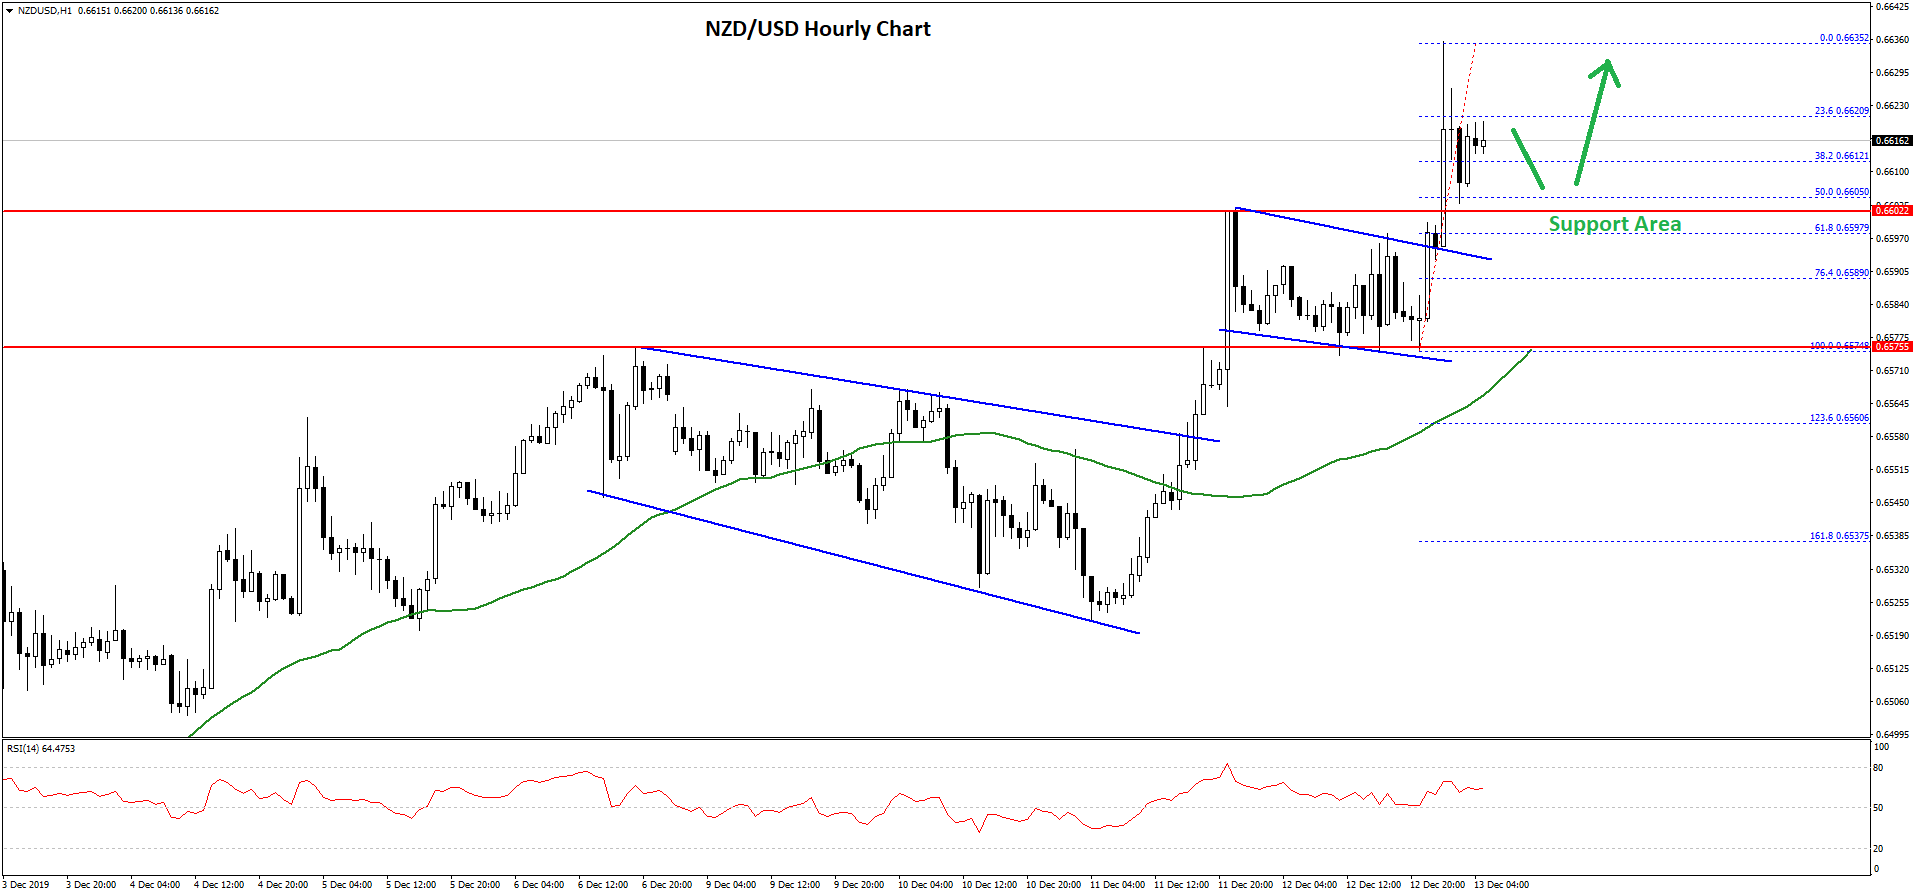
Finally, the pair rallied above the 0.6620 level and a high was formed near the 0.6635 level. Recently, the pair corrected lower below 0.6620. It also broke the 23.6% Fib retracement level of the recent wave from the 0.6574 low to 0.6635 high.
However, the 0.6605 and 0.6600 support levels are acting as strong buy zones. Besides, the 50% Fib retracement level of the recent wave from the 0.6574 low to 0.6635 high is also near the 0.6605 level.
Therefore, a downside break below the 0.6600 support might push the pair further lower towards the 0.6575 support.
On the upside, the pair is facing hurdles near 0.6630 and 0.6635 levels, above which the bulls are likely to aim the 0.6660 level in the near term. The next key resistance could be near the 0.6680 level.
Trade over 50 forex markets 24 hours a day with FXOpen. Take advantage of low commissions, deep liquidity, and spreads from 0.0 pips. Open your FXOpen account now or learn more about trading forex with FXOpen.
This article represents the opinion of the Companies operating under the FXOpen brand only. It is not to be construed as an offer, solicitation, or recommendation with respect to products and services provided by the Companies operating under the FXOpen brand, nor is it to be considered financial advice.
Latest from Forex Analysis
Latest articles

Since the Start of the Week, Brent Oil Price Has Dropped over 4%
At the beginning of the week, March 15, we wrote that the price of Brent oil could form a correction from the resistance level of USD 91 per barrel. Since then, the price has decreased by more than 4% due

Fair Value Gaps vs Liquidity Voids in Trading
Understanding fair value gaps and liquidity voids is essential for traders seeking to navigate the complexities of the financial markets. These concepts, deeply rooted in the Smart Money Concept (SMC), provide valuable insights into the dynamics of supply and demand,

UK100 Share Index Rises as UK Inflation Slows
Yesterday, the UK Office for National Statistics (ONS) reported that the CPI stood at 3.2% in March. According to ForexFactory, analysts expected 3.1%, and a month ago the index was 3.4%.
Grant Fitzner, chief economist at the