


AUD/USD and NZD/USD Might Regain Bullish Momentum
FXOpen
AUD/USD traded higher but faced sellers near 0.7075. NZD/USD is correcting gains and approaching a key support zone near the 0.6350 level.
Important Takeaways for AUD/USD and NZD/USD
· The Aussie Dollar started a fresh increase from the 0.6850 support zone against the US Dollar.
· There is a key bullish trend line forming with support near 0.7000 on the hourly chart of AUD/USD.
· NZD/USD also started a decent increase after it cleared the 0.6300 resistance zone.
· There was a move above a major contracting triangle with resistance near 0.6355 on the hourly chart of NZD/USD.
AUD/USD Technical Analysis
The Aussie Dollar formed a base above the 0.6850 level and started a fresh increase against the US Dollar. The AUD/USD pair gained pace for a move above the 0.6950 resistance zone.
There was a clear move above the 0.7000 resistance zone and the 50 hourly simple moving average. The pair traded as high as 0.7072 on FXOpen and is currently correcting gains. There was a move below the 0.7025 support zone.
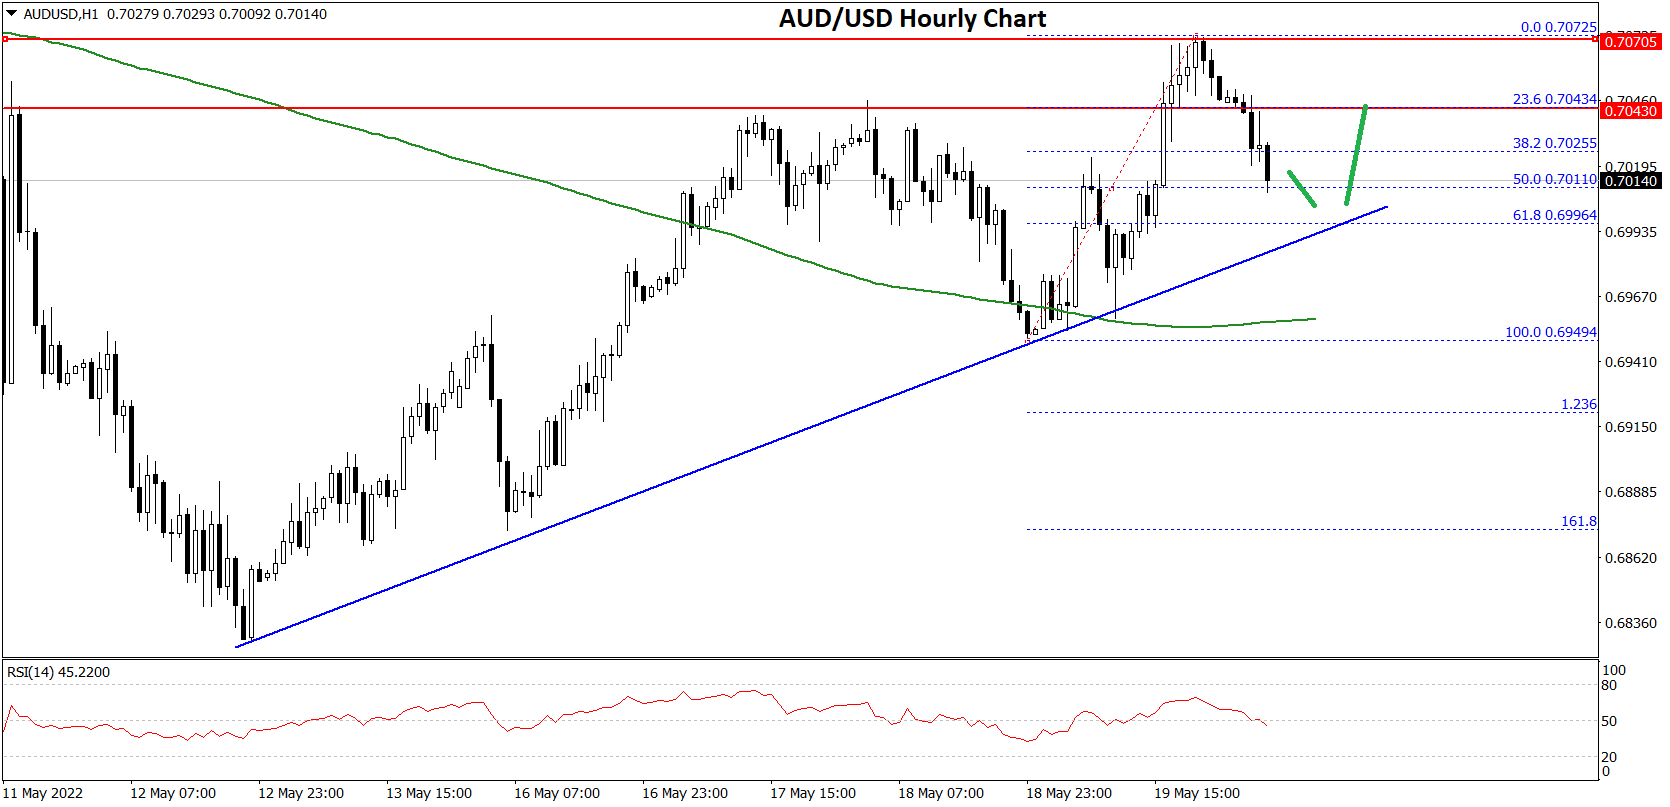
The pair is now trading near the 50% Fib retracement level of the upward move from the 0.6949 swing low to 0.7072 high. On the downside, an initial support is near the 0.7000 level.
There is also a key bullish trend line forming with support near 0.7000 on the hourly chart of AUD/USD. The trend line is near the 61.8% Fib retracement level of the upward move from the 0.6949 swing low to 0.7072 high.
The next support could be the 0.6950 level. If there is a downside break below the 0.6950 support, the pair could extend its decline towards the 0.6900 level. Any more downsides might send the pair toward the 0.6850 level.
On the upside, the AUD/USD pair is facing resistance near the 0.7040 level. The next major resistance is near the 0.7075 level. A close above the 0.7075 level could start a steady increase in the near term. The next major resistance could be 0.7150.
NZD/USD Technical Analysis
The New Zealand Dollar also followed a similar path from the 0.6220 zone against the US Dollar. The NZD/USD pair gained pace above the 0.6300 resistance zone.
There was a clear move above the 0.6350 resistance zone and the 50 hourly simple moving average. Besides, there was a move above a major contracting triangle with resistance near 0.6355 on the hourly chart of NZD/USD.
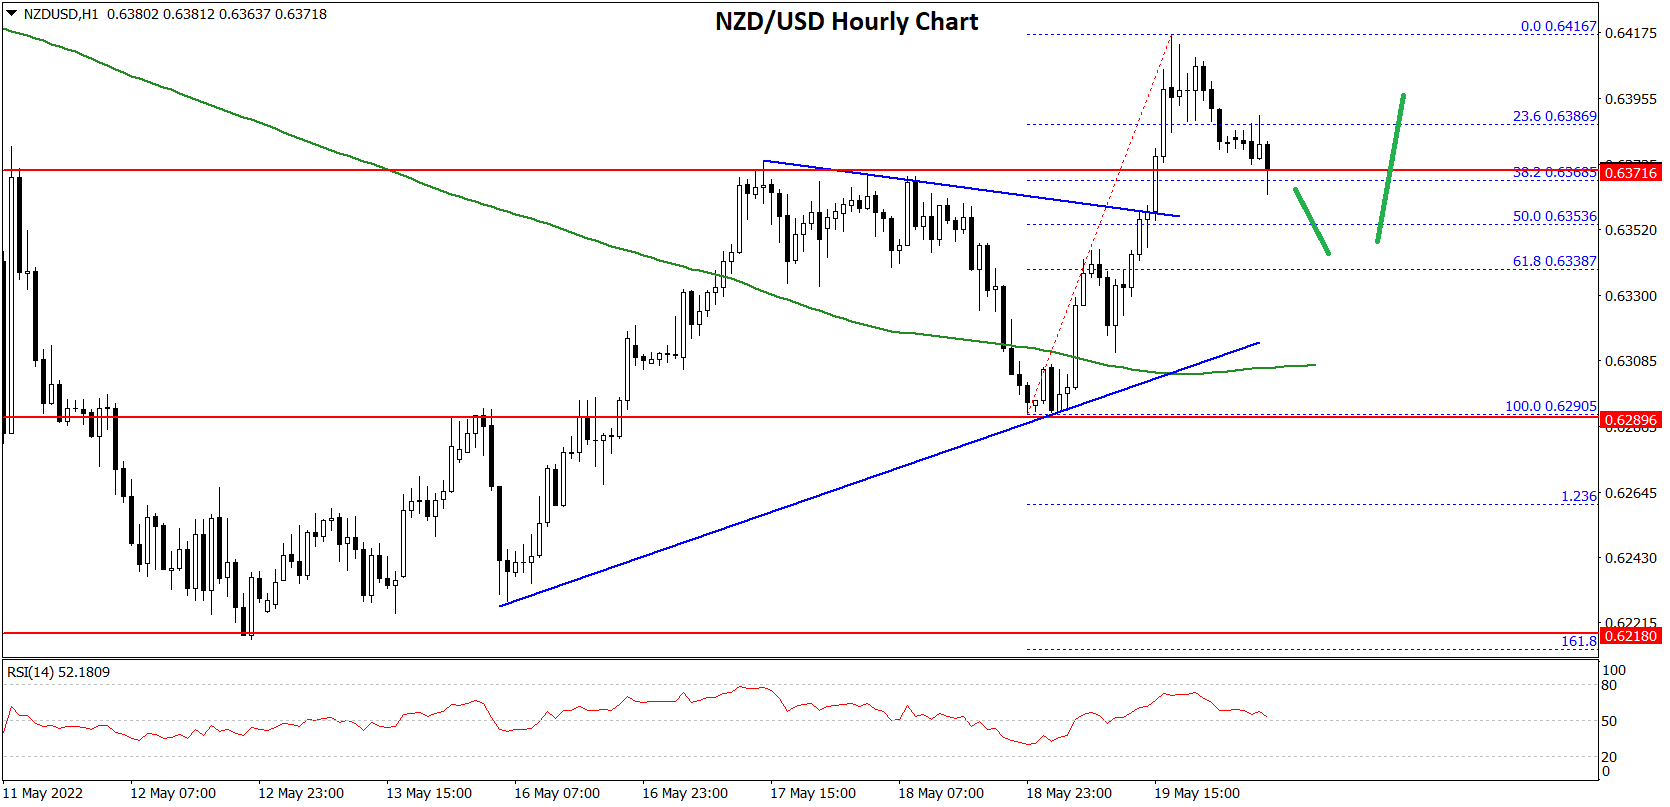
It even spiked above the 0.6400 level and traded as high as 0.6416. It is now correcting gains and trading below the 23.6% Fib retracement level of the upward move from the 0.6290 swing low to 0.6416 high.
On the downside, an initial support is near the 0.6350 level. It is near the 50% Fib retracement level of the upward move from the 0.6290 swing low to 0.6416 high. The next support could be the 0.6330 zone. If there is a downside break below the 0.6330 support, the pair could extend its decline towards the 0.6300 level.
On the upside, an initial resistance is near the 0.6400 level. The next major resistance is near the 0.6420 level. A clear move above the 0.6420 level might even push the pair towards the 0.6480 level.
This forecast represents FXOpen Markets Limited opinion only, it should not be construed as an offer, invitation or recommendation in respect to FXOpen Markets Limited products and services or as financial advice.
Trade over 50 forex markets 24 hours a day with FXOpen. Take advantage of low commissions, deep liquidity, and spreads from 0.0 pips (additional fees may apply). Open your FXOpen account now or learn more about trading forex with FXOpen.
This article represents the opinion of the Companies operating under the FXOpen brand only. It is not to be construed as an offer, solicitation, or recommendation with respect to products and services provided by the Companies operating under the FXOpen brand, nor is it to be considered financial advice.
Stay ahead of the market!
Subscribe now to our mailing list and receive the latest market news and insights delivered directly to your inbox.


Latest articles

DAX 40: Can the Index Print Fresh Record Highs Once Again?
The DAX 40 has shed more than 2% over the past several sessions, breaking a rally that had pushed the index to record highs on the back of Germany's fiscal pivot toward defence, infrastructure and climate spending. The pullback raises

US Dollar Consolidates Ahead of FOMC Minutes Release
The US dollar has entered a period of consolidation following last week's sharp price swings, as market participants turn their attention to the release of the Federal Reserve's latest meeting minutes. Investors are looking for additional guidance on the future

EUR/USD Analysis: Who Is in Control?
Two central banks, two hawkish tones — but only one dollar just took a hit. The ECB delivered a 25bp hike in June, its first since 2023, lifting the deposit rate to 2.25% as Middle East-driven energy costs pushed headline