


FXOpen

AUD/USD is trading in a positive zone above the 0.7200 resistance zone. Similarly, NZD/USD is gaining traction and it could continue to climb higher above the 0.6700 resistance.
Important Takeaways for AUD/USD and NZD/USD
- The Aussie Dollar started a steady rise above the 0.7120 resistance zone against the US Dollar.
- There is a major ascending channel forming with support near 0.7165 on the hourly chart of AUD/USD.
- NZD/USD climbed higher above the 0.6600 and 0.6650 resistance levels.
- There was a break above a connecting bearish trend line with resistance near 0.6655 on the hourly chart of NZD/USD.
AUD/USD Technical Analysis
The Aussie Dollar remained well bid above the 0.7100 level and started a steady rise against the US Dollar. The AUD/USD pair broke the 0.7150 resistance zone to move further into a positive zone.
The pair even managed to clear the 0.7200 resistance zone and it settled nicely above the 50 hourly simple moving average. It traded as high as 0.0.7224 on FXOpen and it is currently correcting gains.
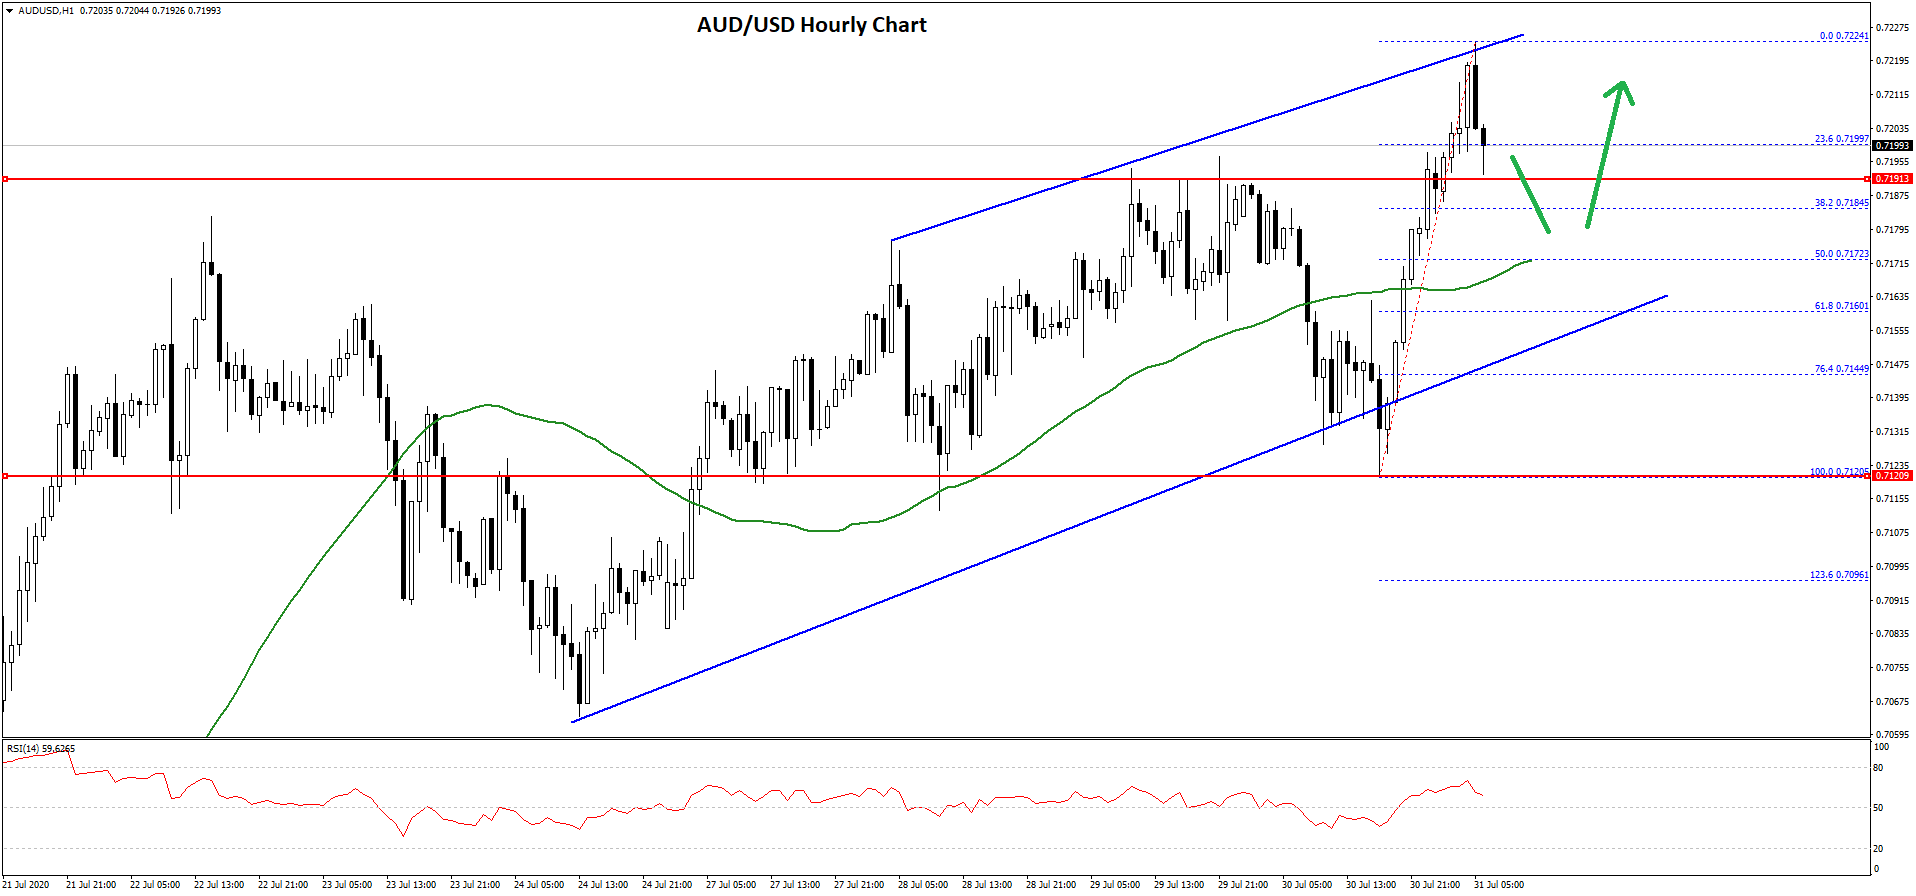
There was break below the 0.7220 and 0.7210 levels. The pair even spiked below the 23.6% Fib retracement level of the recent upward move from the 0.7120 low to 0.7224 high. However, the recent breakout zone near 0.7195 and 0.7200 is currently acting as a strong support.
There is also a major ascending channel forming with support near 0.7165 on the hourly chart of AUD/USD. An intermediate support is near the 0.7175 level and the 50 hourly simple moving average.
The 50% Fib retracement level of the recent upward move from the 0.7120 low to 0.7224 high could also provide support in the near term near 0.7172. If the pair fails to stay above the 0.7175 and 0.7160 support levels, it could correct lower towards the 0.7120 support zone.
Conversely, the pair is likely to resume its upward move above the 0.7220 resistance. The next major resistance on the upside is visible near the 0.7250 level.
NZD/USD Technical Analysis
The New Zealand Dollar followed a similar path and it surpassed the 0.6650 resistance zone against the US Dollar. The NZD/USD pair formed a strong support base above 0.6640 and 0.6650 before starting an upward move.
During the rise, there was a break above a connecting bearish trend line with resistance near 0.6655 on the hourly chart of NZD/USD. The pair even climbed above the 0.6700 level and settled well above the 50 hourly simple moving average.
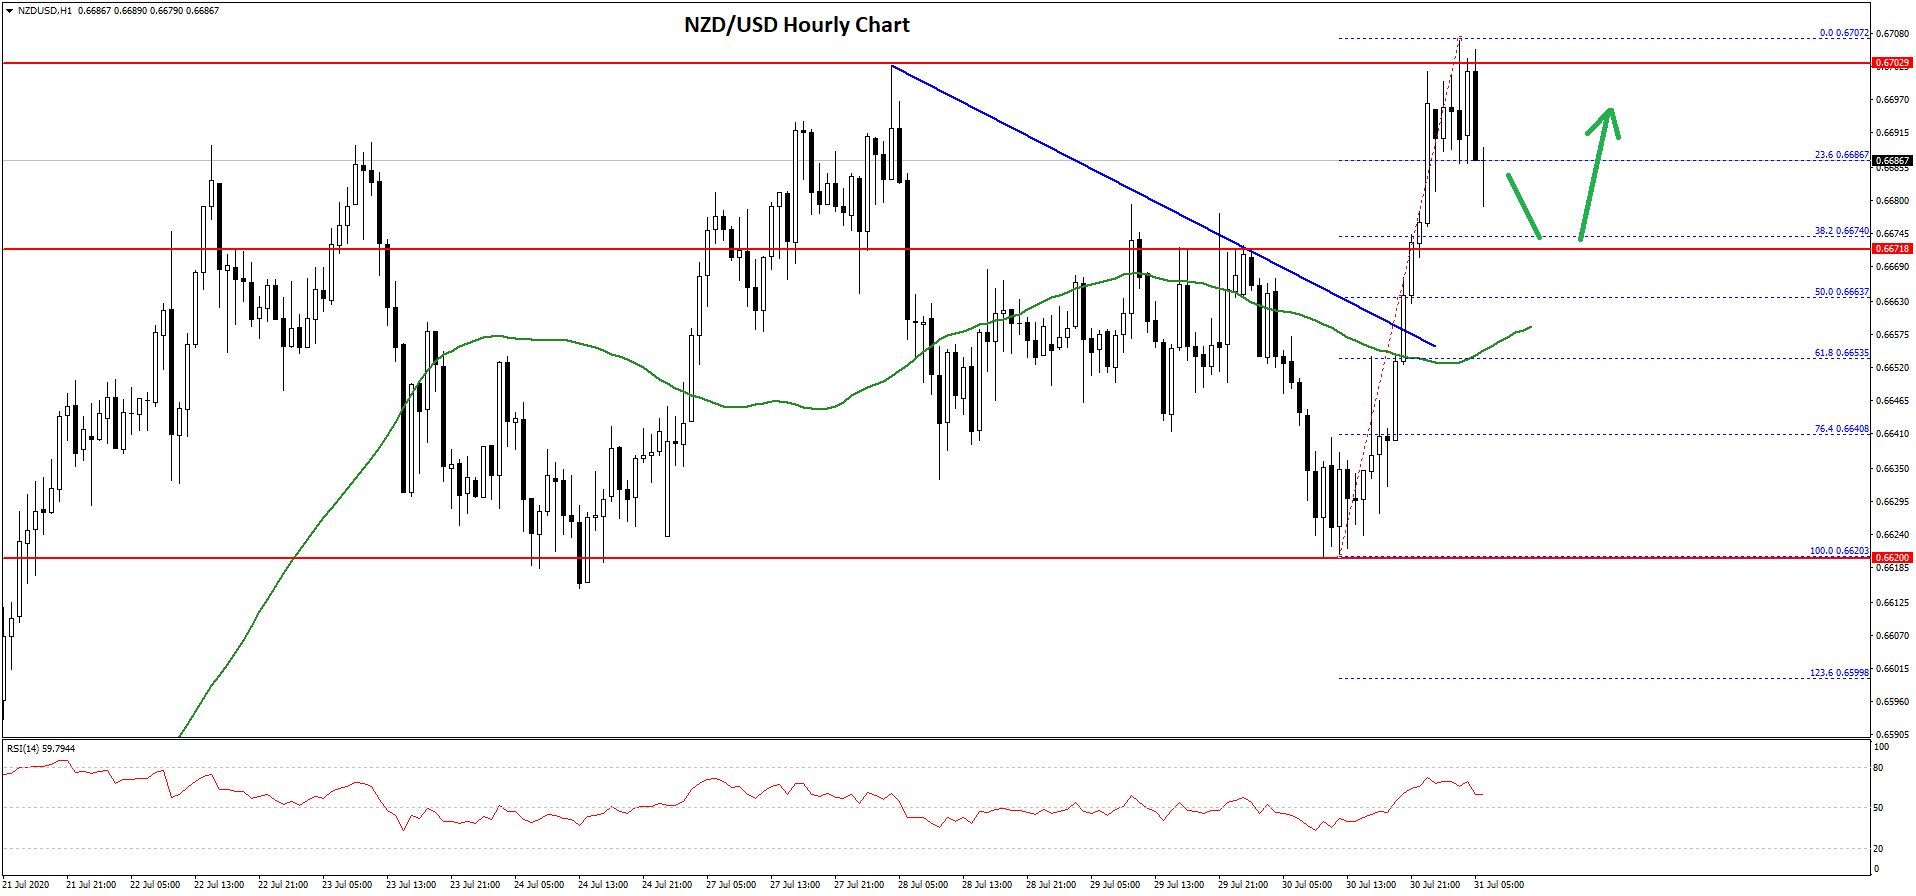
The pair traded to a new weekly high near 0.6707 and it is currently correcting gains. There was a break below the 0.6700 level, plus the 23.6% Fib retracement level of the upward move from the 0.6620 low to 0.6707 high.
On the downside, the 0.6680 level is acting as a strong support for the bulls. The first major support is seen near the 0.6670 level (the recent breakout zone).
The next major support is near the 0.6660 level or the 50% Fib retracement level of the upward move from the 0.6620 low to 0.6707 high. The 50 hourly simple moving average is also near the 0.6655 level to act as a support.
Therefore, dips in NZD/USD could find support near 0.6670 or 0.6660. Any further losses may perhaps push it into a bearish zone towards the 0.6620 level.
On the upside, an initial resistance is seen near the 0.6710 level, above which NZD/USD might continue to rise towards 0.6750 or even 0.6765 in the near term.
Trade over 50 forex markets 24 hours a day with FXOpen. Take advantage of low commissions, deep liquidity, and spreads from 0.0 pips. Open your FXOpen account now or learn more about trading forex with FXOpen.
This article represents the opinion of the Companies operating under the FXOpen brand only. It is not to be construed as an offer, solicitation, or recommendation with respect to products and services provided by the Companies operating under the FXOpen brand, nor is it to be considered financial advice.
Latest from Forex Analysis
Latest articles

Weekly Market Wrap With Gary Thomson: UK100, USD, GOLD, OIL
Get the latest scoop on the week's hottest headlines, all in one convenient video. Join Gary Thomson, the COO of FXOpen UK, as he breaks down the most significant news reports and shares his expert insights.
- UK100 Share Index Rises

What Is a Darvas Box Theory and How Does It Work in Trading?
The Darvas Box Theory, pioneered by Nicolas Darvas in the 1950s, has transcended its stock market origins to become a valuable tool for forex traders. This method leverages specific price movements and patterns, known as the Darvas Box, to track

NFLX Stock Price Falls Despite Subscriber Growth
Yesterday, after the close of the main trading session on the stock market, Netflix reported to investors for the 1st quarter of 2024.
The report turned out better than expected:
→ earnings per share: actual = USD 5.28, forecast = USD 4.