


FXOpen

AUD/USD is slowly rising and trading above the 0.6900 pivot level. Similarly, NZD/USD is gaining traction and it could continue to rise towards the 0.6550 resistance level.
Important Takeaways for AUD/USD and NZD/USD
- The Aussie Dollar formed a strong support near 0.6850 and recovered higher against the US Dollar.
- There is a key rising channel forming with support near 0.6920 on the hourly chart of AUD/USD.
- NZD/USD climbed higher nicely above the 0.6480 and 0.6500 resistance levels.
- There is a short-term bullish trend line forming with support at 0.6505 on the hourly chart of NZD/USD.
AUD/USD Technical Analysis
The Aussie Dollar formed a strong support above 0.6840 and started a fresh increase against the US Dollar. The AUD/USD pair broke the 0.6890 resistance zone to move into a positive zone.
The pair gained pace, and managed to settle above the 0.6900 level and the 50 hourly simple moving average. It traded as high as 0.6952 on FXOpen and it is currently correcting gains.
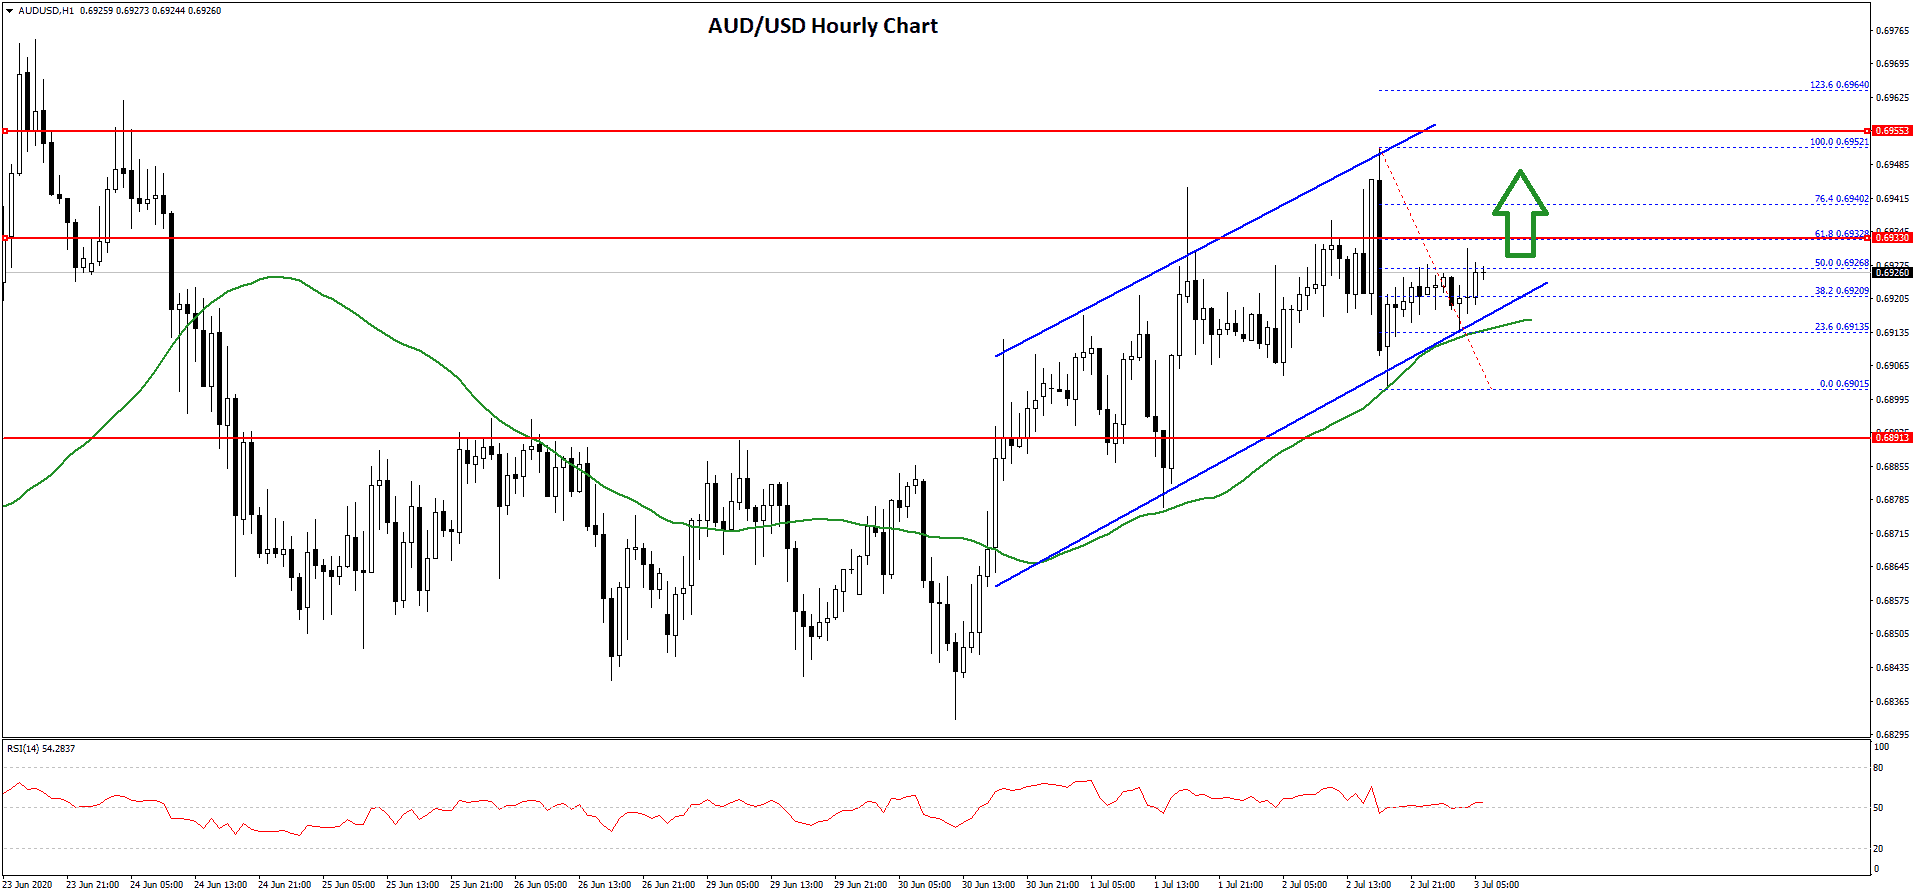
There was a short-term downward move below 0.6920, but the 0.6900 zone acted as a support. A low is formed near 0.6901 and the pair is currently rising. It broke the 0.36920 level, plus the 50% Fib retracement level of the recent decline from the 0.6951 high to 0.6901 low.
An immediate resistance is near the 0.6932 level. It is close to the 61.8% Fib retracement level of the recent decline from the 0.6951 high to 0.6901 low. If there is an upside break above 0.6932, the pair is likely to continue higher.
Moreover, it seems like there is a key rising channel forming with support near 0.6920 on the hourly chart of AUD/USD. On the upside, an initial hurdle is near the 0.6950 level, above which the bulls are likely to aim a break towards the 0.7000 resistance.
Conversely, there is a risk of a bearish reaction below the 0.6910 level and the 50 hourly SMA. If the pair breaks the 0.6900 support, it could decline back towards the 0.6850 support area.
NZD/USD Technical Analysis
The New Zealand Dollar followed a strong bullish path after it broke a declining channel at 0.6425 against the US Dollar. The NZD/USD pair gained pace above the 0.6440 and 0.6450 resistance levels.
There was also a close above the 0.6480 resistance and the 50 hourly simple moving average. The pair traded to a new weekly high near 0.6537 and it is currently correcting gains.
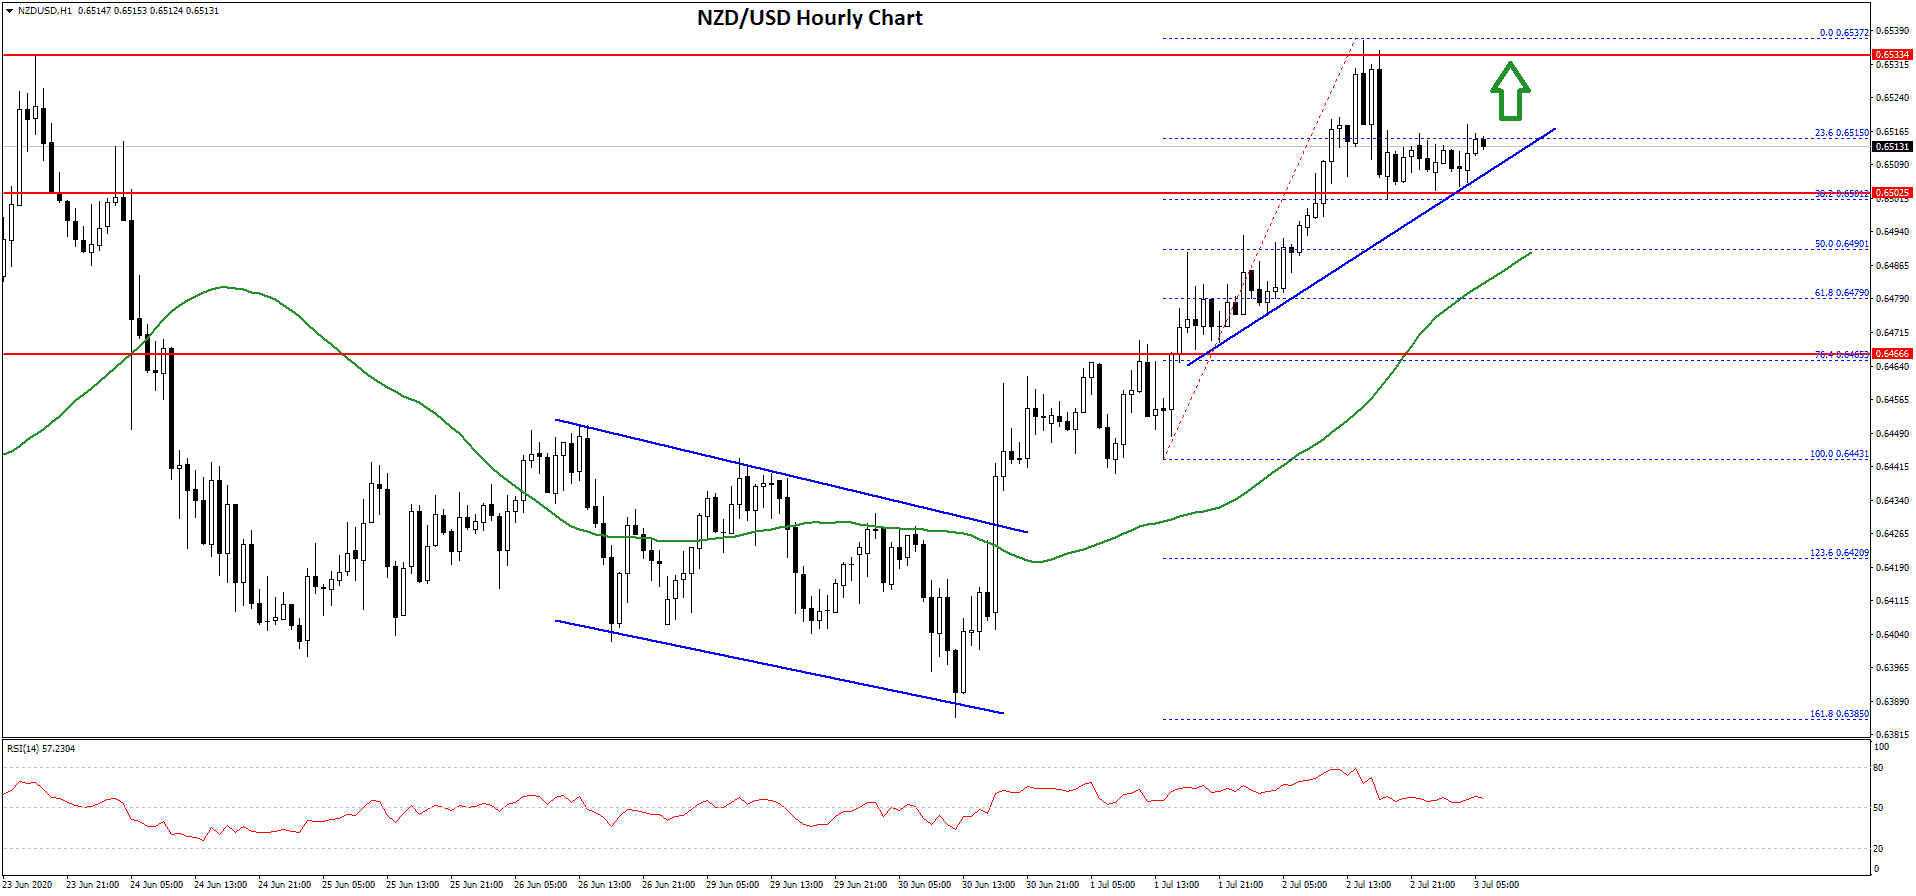
It traded below the 0.6520 level, plus the 23.6% Fib retracement level of the upward move from the 0.6443 low to 0.6537 high. On the downside, the 0.6500 area is acting as a strong support for the bulls.
There is also a short-term bullish trend line forming with support at 0.6505 on the hourly chart of NZD/USD. If the pair breaks the trend line support, the next support is seen near the 0.6490 level and the 50 hourly simple moving average.
The 50% Fib retracement level of the upward move from the 0.6443 low to 0.6537 high is also near the 0.6490 level. Therefore, dips are likely to remain supported near the 0.6500 and 0.6490 levels.
On the upside, an initial resistance is seen near the 0.6530 level, above which NZD/USD might continue to rise towards 0.6550 or even 0.6585 in the near term.
Trade over 50 forex markets 24 hours a day with FXOpen. Take advantage of low commissions, deep liquidity, and spreads from 0.0 pips. Open your FXOpen account now or learn more about trading forex with FXOpen.
This article represents the opinion of the Companies operating under the FXOpen brand only. It is not to be construed as an offer, solicitation, or recommendation with respect to products and services provided by the Companies operating under the FXOpen brand, nor is it to be considered financial advice.
Latest from Forex Analysis
Latest articles

Weekly Market Wrap With Gary Thomson: UK100, USD, GOLD, OIL
Get the latest scoop on the week's hottest headlines, all in one convenient video. Join Gary Thomson, the COO of FXOpen UK, as he breaks down the most significant news reports and shares his expert insights.
- UK100 Share Index Rises

What Is a Darvas Box Theory and How Does It Work in Trading?
The Darvas Box Theory, pioneered by Nicolas Darvas in the 1950s, has transcended its stock market origins to become a valuable tool for forex traders. This method leverages specific price movements and patterns, known as the Darvas Box, to track

NFLX Stock Price Falls Despite Subscriber Growth
Yesterday, after the close of the main trading session on the stock market, Netflix reported to investors for the 1st quarter of 2024.
The report turned out better than expected:
→ earnings per share: actual = USD 5.28, forecast = USD 4.