


AUD/USD and NZD/USD Could Eye More Upsides
FXOpen
AUD/USD started a fresh increase above the 0.7260 resistance zone. NZD/USD also climbed higher and it might continue to rise towards the 0.7150 level.
Important Takeaways for AUD/USD and NZD/USD
· The Aussie Dollar started a decent increase above the 0.7260 barrier against the US Dollar.
· There was a break above a major bearish trend line with resistance near 0.7260 on the hourly chart of AUD/USD.
· NZD/USD also gained pace after it broke the 0.7020 resistance.
· There was a break above a key bearish trend line with resistance near 0.7020 on the hourly chart of NZD/USD.
AUD/USD Technical Analysis
After a steady decline, the Aussie Dollar found support near the 0.7225 zone against the US Dollar. The AUD/USD pair formed a base above the 0.7220 level and recently started a fresh increase.
The pair broke the 0.7250 and 0.7260 resistance levels. There was also a break above a major bearish trend line with resistance near 0.7260 on the hourly chart of AUD/USD. The pair even cleared the 0.7300 level and the 50 hourly simple moving average.
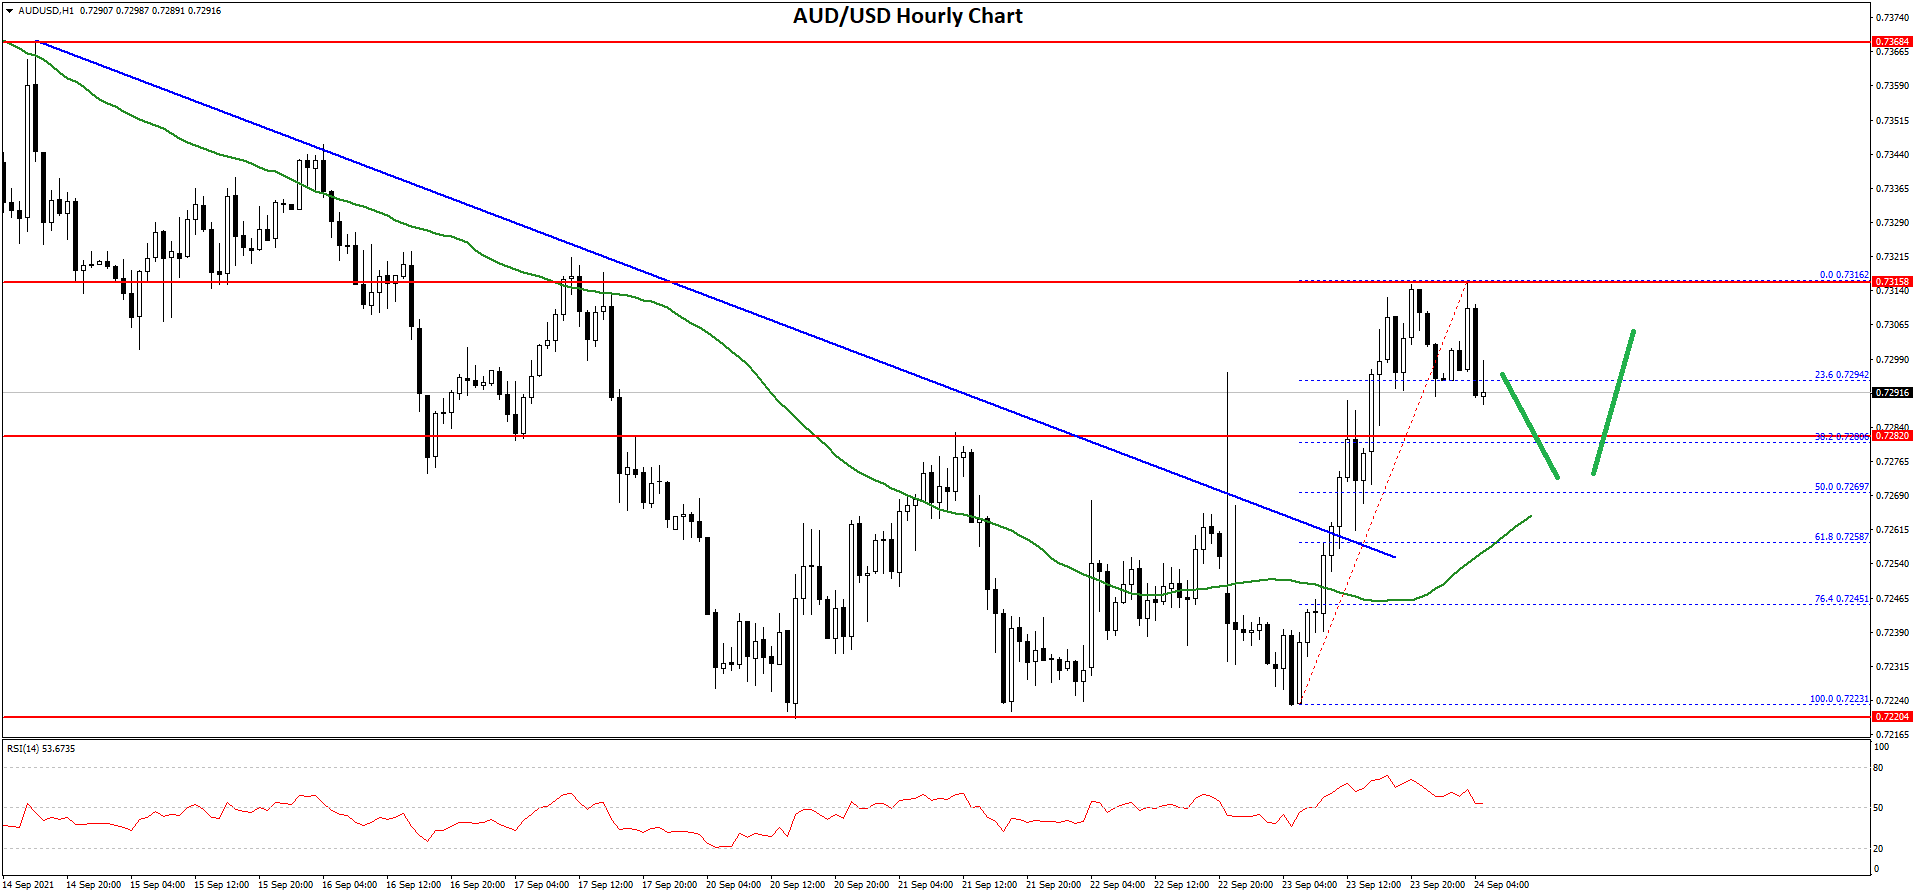
A high was formed near 0.7316 on FXOpen and the pair is now consolidating gains. It is trading near the 23.6% Fib retracement level of the recent increase from the 0.7223 swing low to 0.7316 high.
An initial support on the downside is near the 0.7285 level. The next major support is near the 0.7370 level and the 50 hourly simple moving average. It is close to the 50% Fib retracement level of the recent increase from the 0.7223 swing low to 0.7316 high.
If there is a downside break below the 0.7370 support, the pair could extend its decline towards the 0.7325 level.
An immediate resistance is near the 0.7315 level. The next major resistance is near the 0.7320 level. A close above the 0.7320 level could start a steady increase in the near term. The next major resistance could be 0.7365.
NZD/USD Technical Analysis
The New Zealand Dollar also followed a similar path after it declined towards the 0.6980 level against the US Dollar. The NZD/USD pair formed a base near 0.6980 and started a fresh increase.
The pair broke the 0.7000 and 0.7020 resistance levels. There was a break above a key bearish trend line with resistance near 0.7020 on the hourly chart of NZD/USD. The pair even cleared the 0.7080 level and the 50 hourly simple moving average.
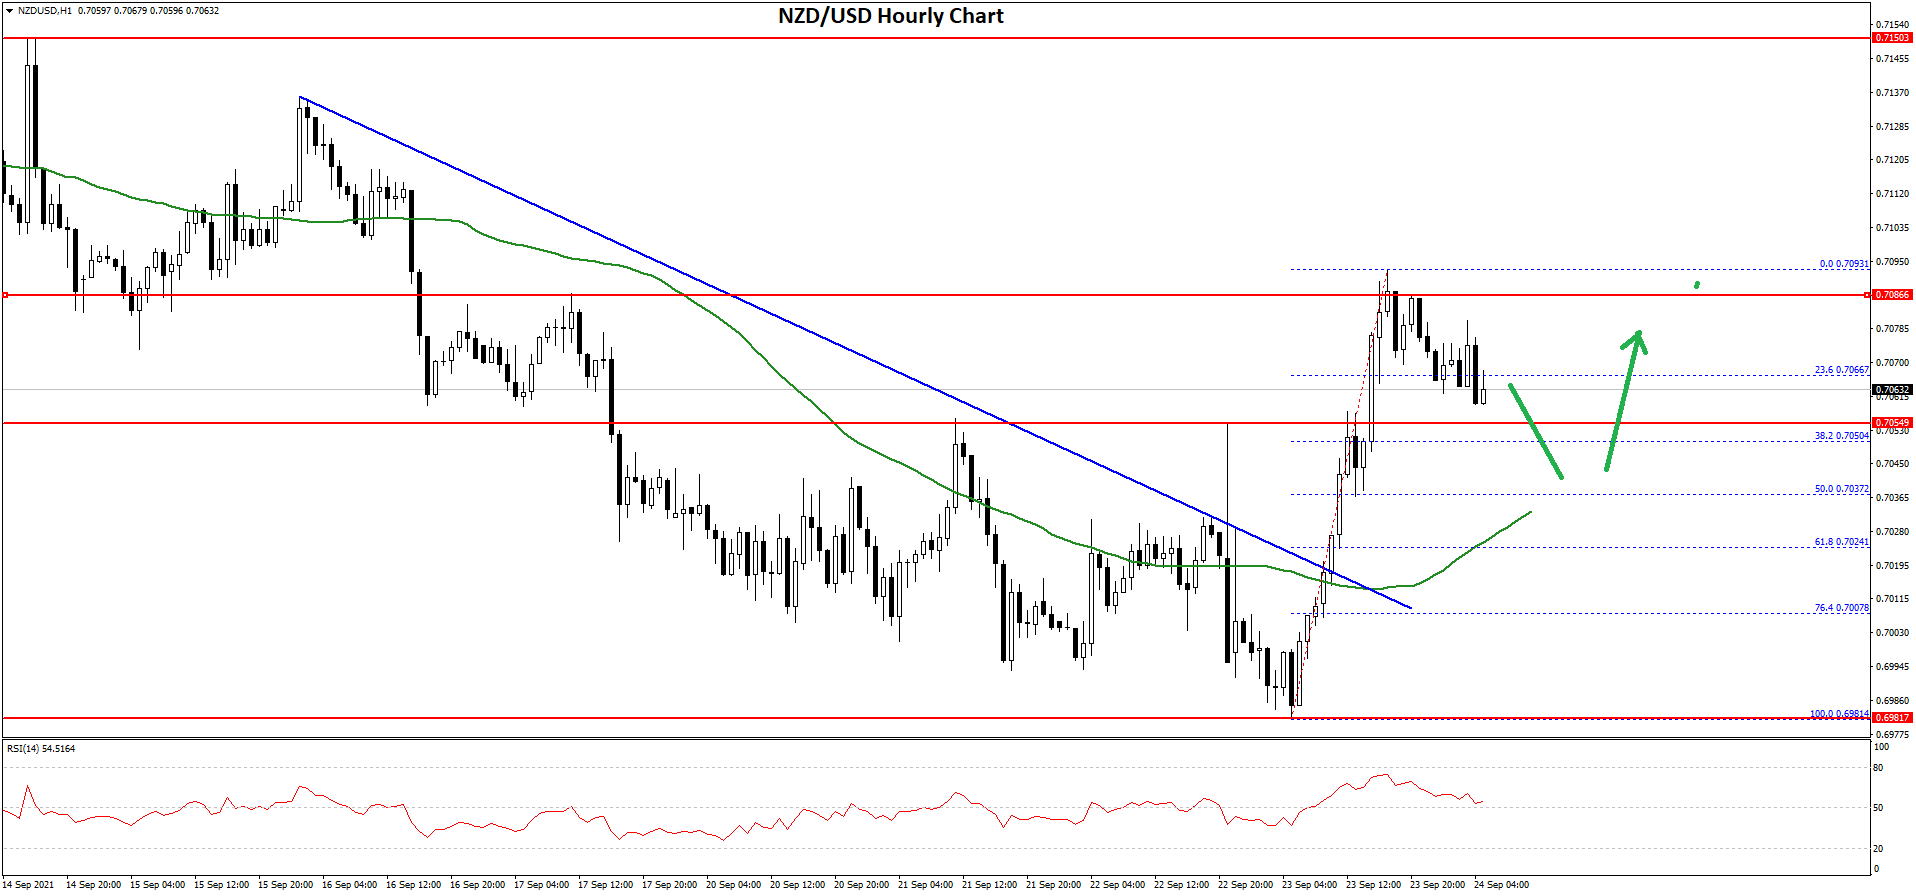
A high was formed near 0.7093 and the pair is now consolidating gains. It is trading near the 23.6% Fib retracement level of the recent wave from the 0.6981 swing low to 0.7093 high.
An immediate support on the downside is near the 0.7055 level. The next major support is near the 0.7035 level and the 50 hourly simple moving average. It is close to the 50% Fib retracement level of the recent wave from the 0.6981 swing low to 0.7093 high.
If there is a downside break below the 0.7035 support, the pair could extend its decline towards the 0.7000 level. On the upside, the bulls are facing hurdles near 0.7080.
The next major resistance is near the 0.7100 level. A close above the 0.7100 level could start a steady increase in the near term. The next major stop for the bulls could be 0.7150.
This forecast represents FXOpen Markets Limited opinion only, it should not be construed as an offer, invitation or recommendation in respect to FXOpen Markets Limited products and services or as financial advice.
This article represents the opinion of the Companies operating under the FXOpen brand only. It is not to be construed as an offer, solicitation, or recommendation with respect to products and services provided by the Companies operating under the FXOpen brand, nor is it to be considered financial advice.
Stay ahead of the market!
Subscribe now to our mailing list and receive the latest market news and insights delivered directly to your inbox.

Latest articles

Market Analysis: EUR/USD Revisits Support While USD/JPY Eyes Bigger Recovery Move
EUR/USD declined from 1.1800 and traded below 1.1750. USD/JPY is rising and might gain pace above 158.00 and 158.80.
Important Takeaways for EUR/USD and USD/JPY Analysis Today
· The Euro started a fresh

Dollar Gains After CPI: USD/JPY and USD/CAD Test Resistance
The US dollar strengthened following the release of stronger-than-expected inflation data, which reinforced expectations that the Federal Reserve will maintain a restrictive monetary policy stance. US consumer prices rose to their highest levels since May 2023, renewing concerns over persistent

XRP/USD: Consolidation Amid Regulatory Expectations
Fundamental Background
The key event for XRP in May remains the fate of the CLARITY Act, which is expected to establish XRP’s status as a digital commodity at the federal level. According to CoinMarketCap, the Senate Banking Committee has