


FXOpen
AUD/USD fell significantly and declined below the 0.6800 support, but later recovered nicely above 0.6940. NZD/USD also declined heavily before buyers appeared near the 0.6580 support.
Important Takeaways for AUD/USD and NZD/USD
- The Aussie Dollar fell heavily below 0.6900 and 0.6800 before buyers appeared near 0.6740 against the US Dollar.
- There was a break above a key bearish trend line with resistance at 0.6955 on the hourly chart of AUD/USD.
- NZD/USD tested the 0.6580 support area and later bounced back above 0.6610.
- There is a major bearish trend line formed with resistance at 0.6710 on the hourly chart.
AUD/USD Technical Analysis
The new year opening was super bullish for the US Dollar, resulting in a sharp decline below the 0.7000 support in the Aussie Dollar against the US Dollar. The AUD/USD pair declined below the 0.6900 and 0.6800 support levels.
The pair even broke the 0.6750 support and settled below the 50 hourly simple moving average. A low was formed at 0.6733 on FXOpen and later the pair started a solid upward move.
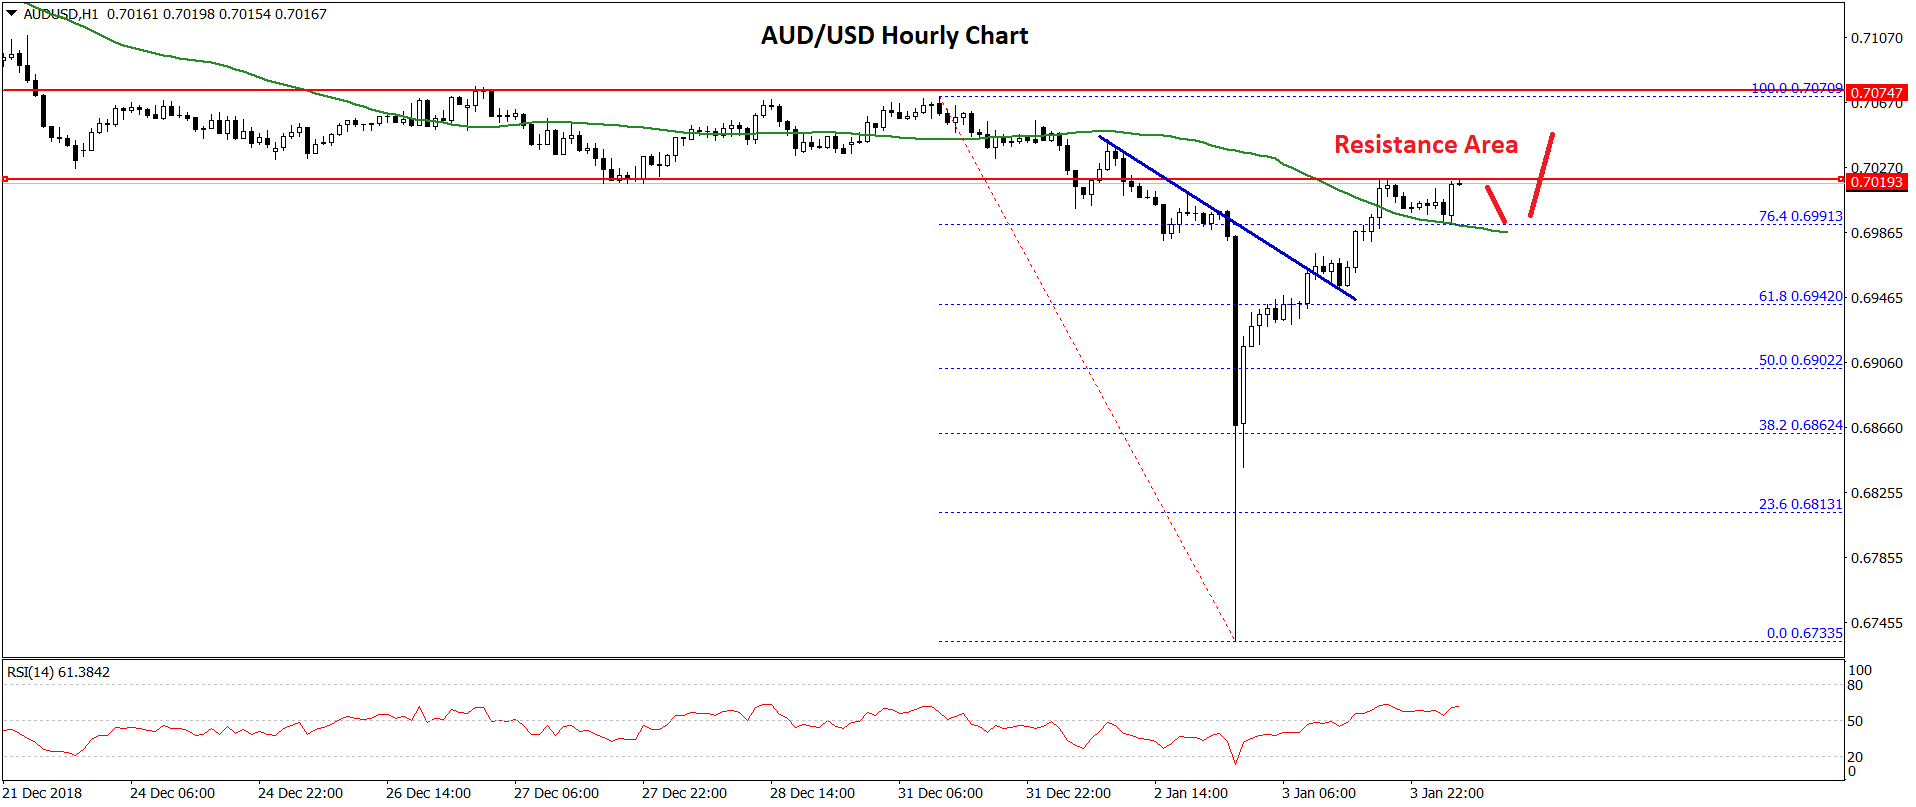
Buyers pushed the price above the 0.6800 and 0.6900 resistance levels. There was also a break above the 50% Fib retracement level of the recent decline from the 0.7070 high to 0.6733 low.
Besides, there was a break above a key bearish trend line with resistance at 0.6955 on the hourly chart of AUD/USD. The recovery was strong as there was a break above the 0.6950 resistance and the 61.8% Fib retracement level of the recent decline from the 0.7070 high to 0.6733 low.
Should there be a proper close above the 0.7000 and 0.7025 resistance levels, there could be more gains towards the 0.7070 level.
On the downside, an initial support is near the 0.6900 level, below which the pair may move back in a bearish zone towards the 0.6850 and 0.6820 support levels in the near term.
NZD/USD Technical Analysis
The New Zealand Dollar also declined sharply and broke the 0.6700 and 0.6650 support levels against the US Dollar. The NZD/USD pair even cleared the 0.6600 support and settled below the 50 hourly simple moving average.
A low was formed at 0.6585 and later the pair recovered sharply. It broke the 0.6640 resistance and the 50% Fib retracement level of the recent decline from the 0.6724 high to 0.6585 low.
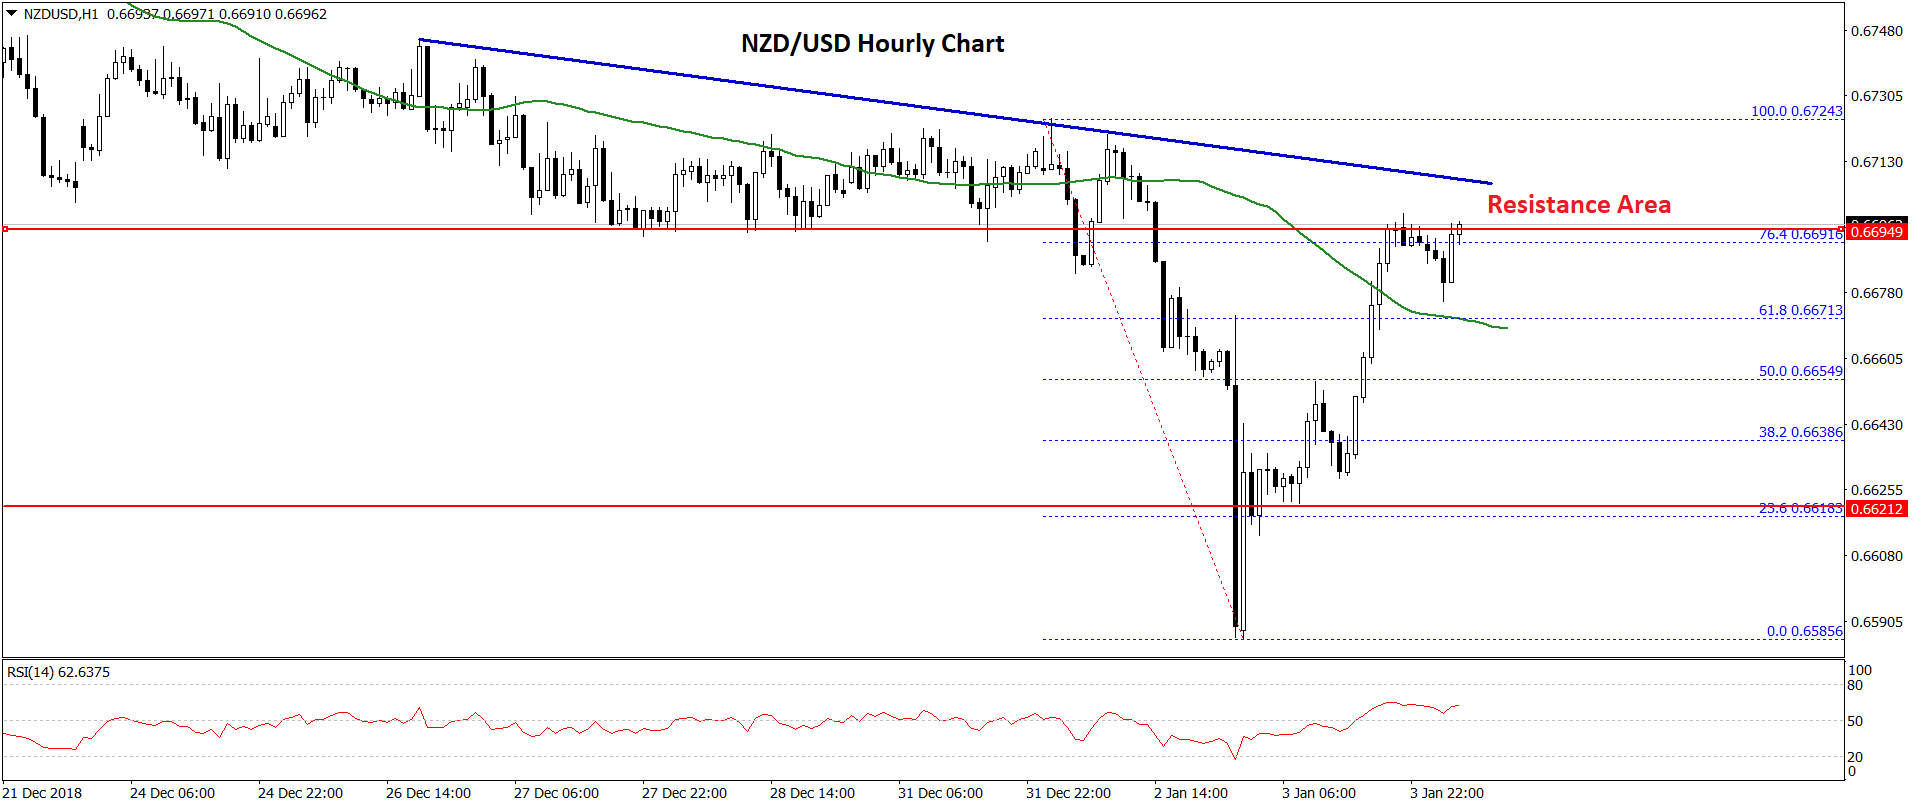
The pair is currently trading with a positive bias, but there is a strong resistance waiting near the 0.6700 level. Moreover, there is a major bearish trend line formed with resistance at 0.6710 on the hourly chart.
Finally, the 76.4% Fib retracement level of the recent decline from the 0.6724 high to 0.6585 low is also near the 0.6690 level to prevent more gains. Therefore, buyers need to push the pair above the 0.6690 and 0.6700 resistance levels to initiate a decent upward move.
On the downside, an initial support is placed near the 0.6620 level, below which the NZD/USD pair could decline towards the 0.6600 support area. Any further gains will most likely set the pace for a fresh low below the 0.6585 in the near term.
Trade over 50 forex markets 24 hours a day with FXOpen. Take advantage of low commissions, deep liquidity, and spreads from 0.0 pips. Open your FXOpen account now or learn more about trading forex with FXOpen.
This article represents the opinion of the Companies operating under the FXOpen brand only. It is not to be construed as an offer, solicitation, or recommendation with respect to products and services provided by the Companies operating under the FXOpen brand, nor is it to be considered financial advice.
Latest from Forex Analysis
Latest articles

Anchored VWAP and How You Can Use It in Forex Trading
In the world of forex trading, understanding the nuanced tools at your disposal can significantly enhance decision-making processes. One such sophisticated tool is the Anchored Volume-Weighted Average Price (Anchored VWAP), which refines the standard VWAP by allowing traders to set

META Share Price Collapses after Publication of Quarterly Report
Just yesterday, META's stock price closed at USD 493.50, up approximately 40% since the start of 2024 and up nearly 300% since the start of 2023.
However, following the release of Meta's quarterly report, its shares plummeted to USD

USD/JPY Analysis: The Rate Exceeds The Level of 155 Yen Per US Dollar
Today, the price of USD/JPY once again renewed its 34-year high, exceeding the level of 155 yen per dollar, which put pressure on the current authorities.
According to Reuters, officials are trying to maintain calm in the market.
"We