


FXOpen

Gold price surged toward the $2,400 zone and traded to a new all-time high. Crude oil is attempting a fresh increase above the $85.00 zone.
Important Takeaways for Gold and Oil Prices Analysis Today
· Gold price started a strong increase above the $2,350 zone against the US Dollar.
· It broke a key bearish trend line with resistance at $2,345 on the hourly chart of gold at FXOpen.
· Crude oil is consolidating above the $84.00 support.
· There is a connecting bearish trend line forming with resistance near $85.60 on the hourly chart of XTI/USD at FXOpen.
Gold Price Technical Analysis
On the hourly chart of Gold at FXOpen, the price formed support near the $2,300 zone. The price remained in a bullish zone and started a strong increase above $2,320.
It broke a key bearish trend line with resistance at $2,345. The bulls even pushed the price above the $2,350 level and the 50-hour simple moving average. Finally, it traded to a new all-time high at $2,395.
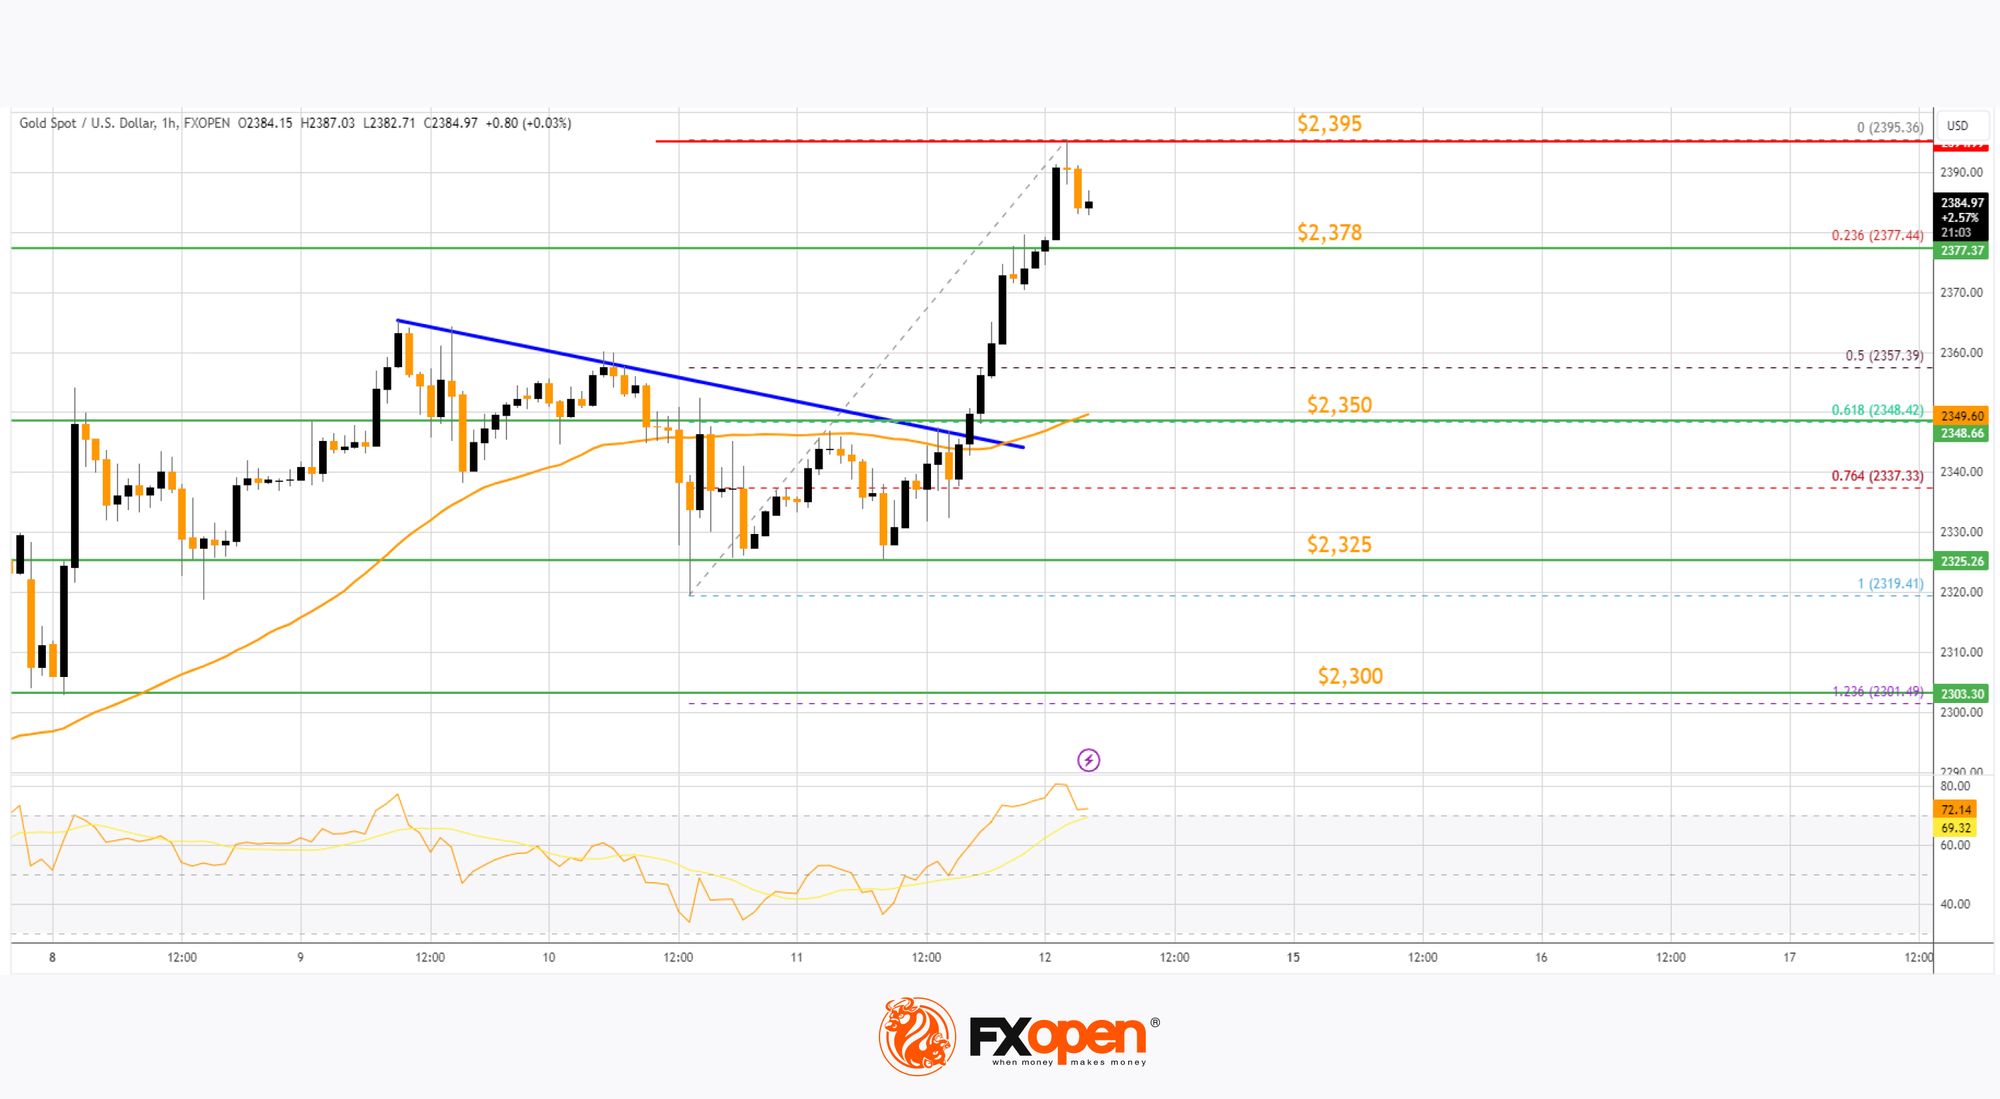
The price is now consolidating gains near the $2,385 zone and the RSI corrected from 80. Initial support on the downside is near the 23.6% Fib retracement level of the upward move from the $2,319 swing low to the $2,395 high at $2,378.
The first major support is near the $2,350 zone and the 50-hour simple moving average. It is close to the 61.8% Fib retracement level of the upward move from the $2,319 swing low to the $2,395 high.
If there is a downside break below the $2,350 support, the price might decline further. In the stated case, the price might drop toward the $2,325 support.
Immediate resistance is near the $2,395 level. The next major resistance is near the $2,400 level. An upside break above the $2,400 resistance could send Gold price toward $2,420. Any more gains may perhaps set the pace for an increase toward the $2,440 level.
Oil Price Technical Analysis
On the hourly chart of WTI Crude Oil at FXOpen, the price found support near the $84.00 zone against the US Dollar. The price formed a base and started a recovery wave above $84.50.
The bulls were able to push the price above the 50% Fib retracement level of the downward move from the $85.99 swing high to the $84.33 swing low. The hourly RSI is near the 50 level, but the price is struggling near the 50-hour simple moving average.
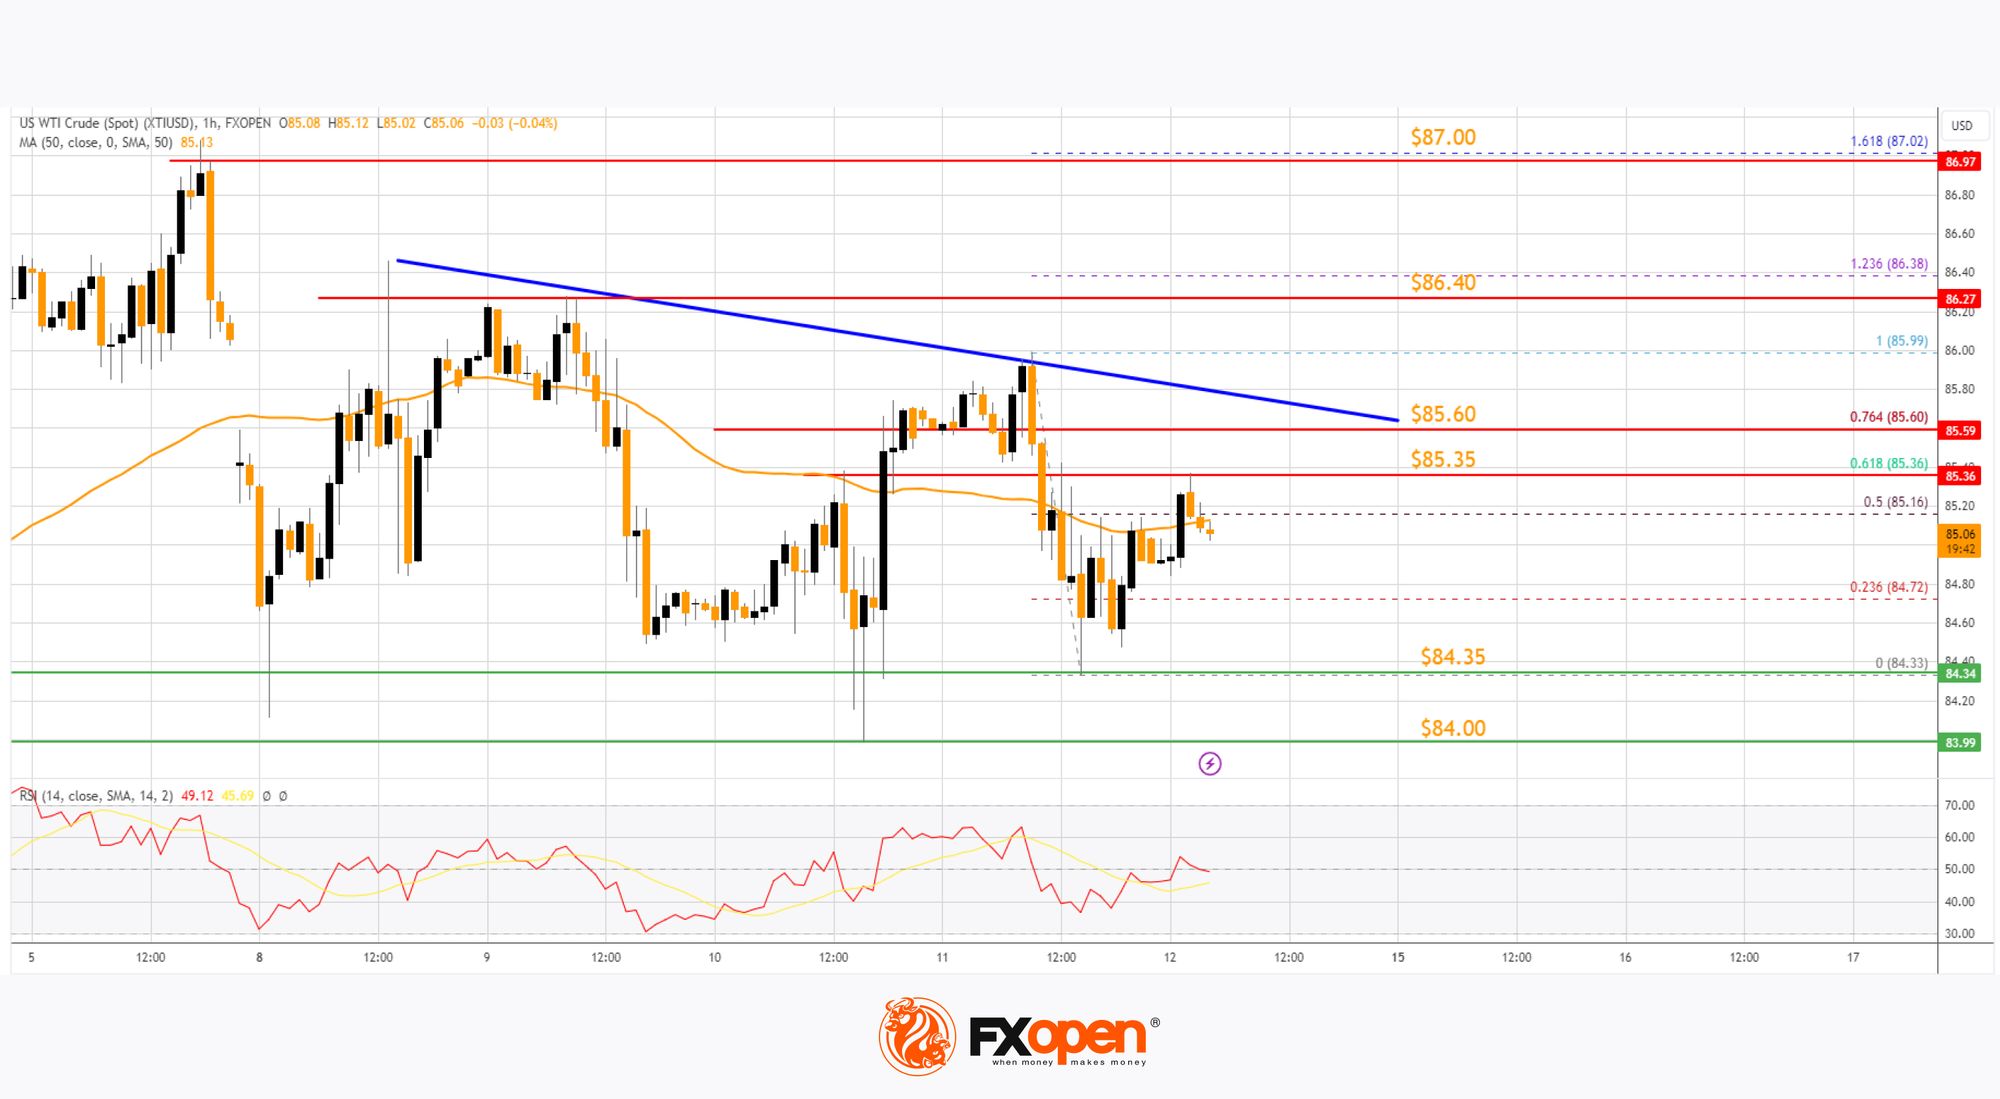
Immediate resistance is near the $85.35 level. There is also a connecting bearish trend line forming with resistance near $85.60. It is close to the 76.4% Fib retracement level of the downward move from the $85.99 swing high to the $84.33 swing low.
A clear move above the trend line resistance could send the price toward the $86.40 resistance. Any more gains might send the price toward the $87.00 level.
Conversely, the price might start a fresh decline from the $85.35 resistance. Immediate support sits near the $84.35 level. The next major support on the WTI crude oil chart is $84.00.
If there is a downside break, the price might decline toward $82.50. Any more losses may perhaps open the doors for a move toward the $81.20 support zone.
Start trading commodity CFDs with tight spreads. Open your trading account now or learn more about trading commodity CFDs with FXOpen.
This article represents the opinion of the Companies operating under the FXOpen brand only. It is not to be construed as an offer, solicitation, or recommendation with respect to products and services provided by the Companies operating under the FXOpen brand, nor is it to be considered financial advice.
Latest from Commodities
Latest articles

Bitcoin Price Hits a Month's High, Breaking Key Resistance
Yesterday's release of CPI figures suggests that inflation is slowing down and a rate cut could be on the horizon. This weakened the dollar and boosted the value of assets priced in dollars, including BTC/USD.
As a result, the

The US Dollar Is Weakening Following Inflation Data
Yesterday saw the release of key economic indicators for the US. According to ForexFactory:
→ Core Price Index (CPI) monthly: actual = 0.3%, expected = 0.4%, previous = 0.4%;
→ Core Price Index (CPI) annual: actual = 3.4%, expected = 3.4%, previous

Analytical XRP Price Forecasts: What Are the Expectations for 2024-2030?
As XRP navigates the volatility and uncertainty of digital currencies, its price trajectory remains a subject of keen interest and speculation. This article delves into the historical price movements, current challenges, and future potential of XRP, offering various analytical predictions