


FXOpen

Gold price rallied above $2,400 before correcting lower. Crude oil price is rising and it could climb further higher toward the $85.50 resistance.
Important Takeaways for Gold and Oil Prices Analysis Today
· Gold price rallied significantly above $2,400 and recently corrected lower against the US Dollar.
· It cleared a key bearish trend line with resistance at $2,310 on the hourly chart of gold at FXOpen.
· Crude oil prices are moving higher above the $82.00 resistance zone.
· There was a break above a connecting bearish trend line with resistance at $82.00 on the hourly chart of XTI/USD at FXOpen.
Gold Price Technical Analysis
On the hourly chart of Gold at FXOpen, the price was able to climb above the $2,350 resistance, as mentioned in the previous analysis. The price even broke the $2,400 level before the bears appeared.
The price traded close to the $2,420 zone before there was a downside correction. There was a move below the $2,355 pivot zone. The price settled below the 50-hour simple moving average and RSI dipped below 50. Finally, it tested the $2,290 zone.
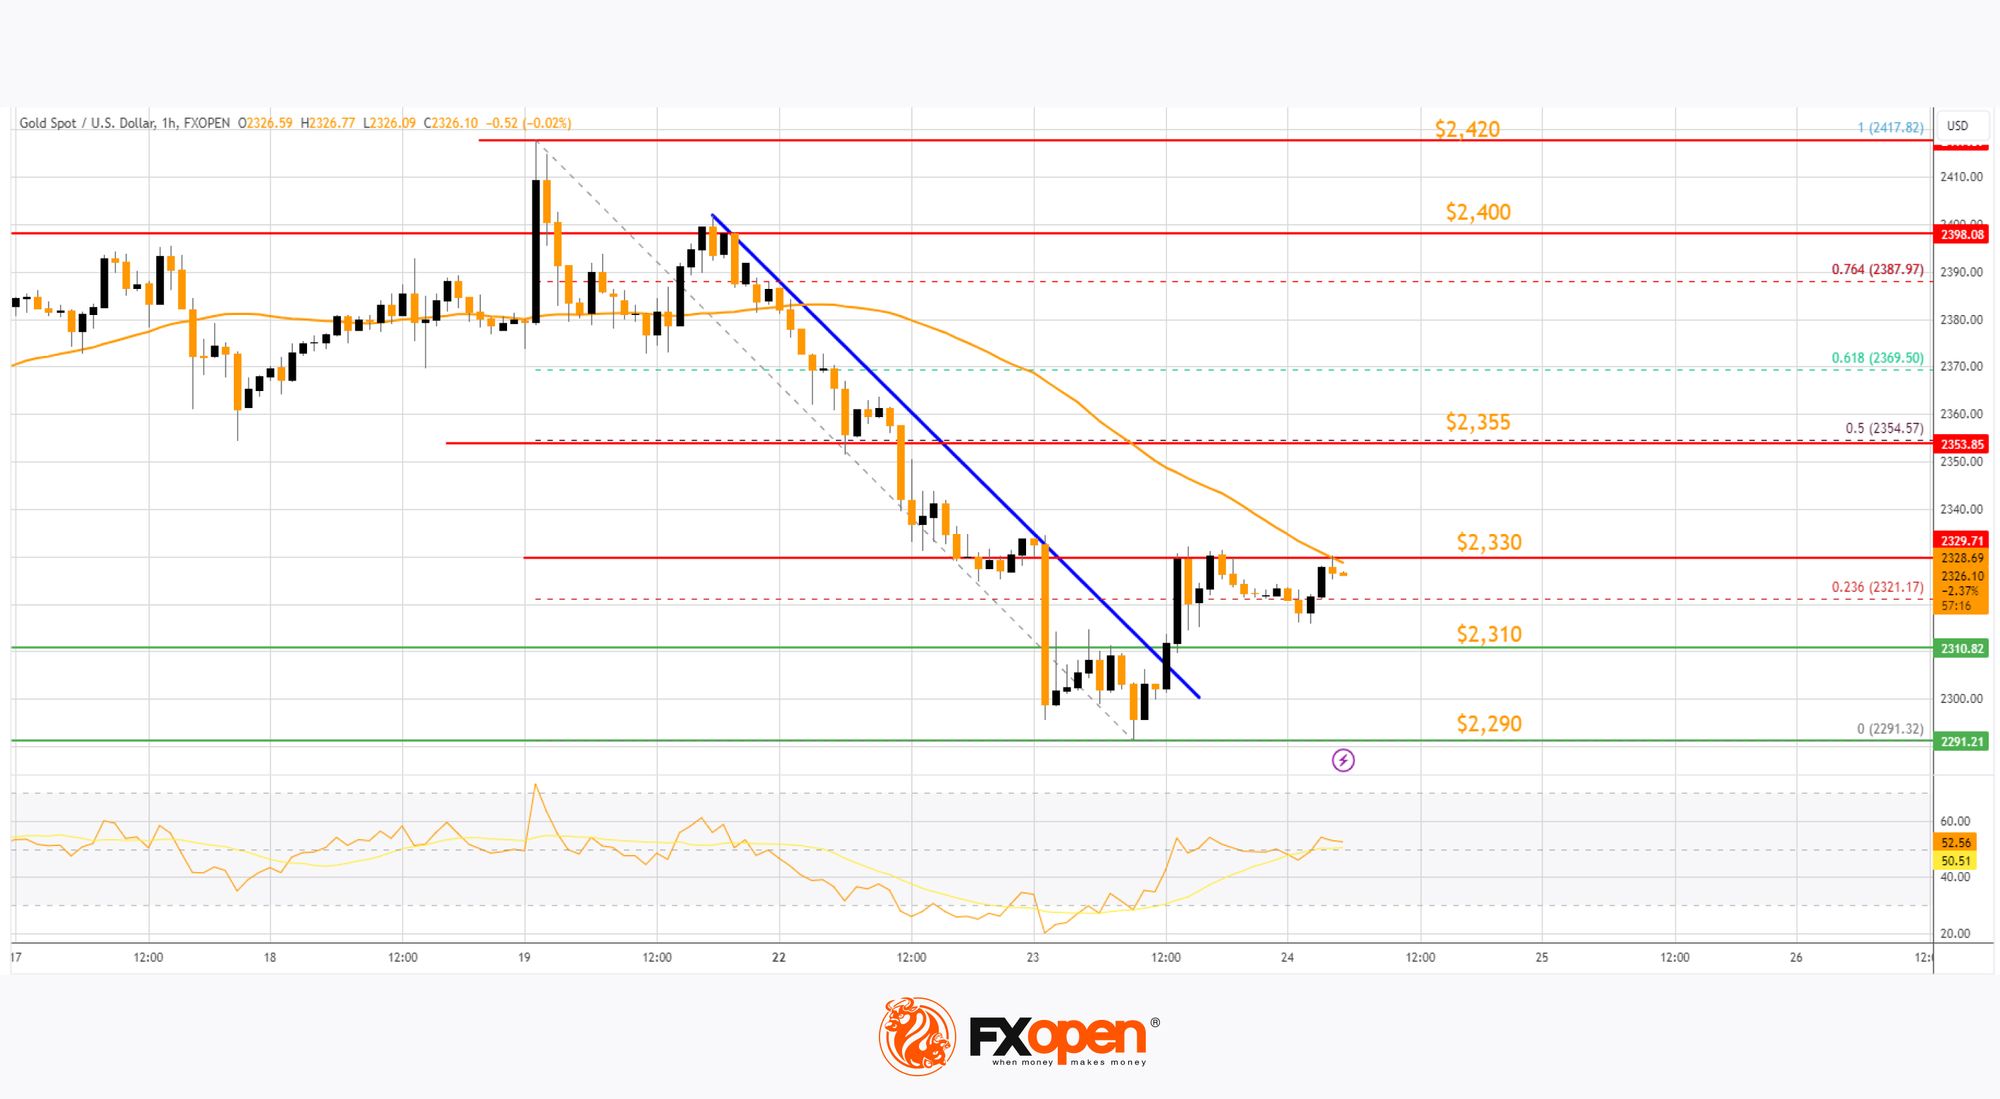
The price is now correcting losses above the 23.6% Fib retracement level of the downward move from the $2,417 swing high to the $2,291 low. It surpassed a key bearish trend line with resistance at $2,310.
Immediate resistance on the upside is near the 50-hour simple moving average and $2,330. The next major resistance is near the 50% Fib retracement level of the downward move from the $2,417 swing high to the $2,291 low at $2,355.
An upside break above the $2,355 resistance could send Gold price toward $2,400. Any more gains may perhaps set the pace for an increase toward the $2,420 level. If there is no fresh increase, the price could continue to move down.
Initial support on the downside is near the $2,310 level. The first major support is $2,290. If there is a downside break below the $2,290 support, the price might decline further. In the stated case, the price might drop toward the $2,265 support.
Oil Price Technical Analysis
On the hourly chart of WTI Crude Oil at FXOpen, the price started a decent increase against the US Dollar. The price gained bullish momentum after it broke the $81.10 resistance.
There was a break above a connecting bearish trend line with resistance at $82.00. The bulls pushed the price above the 50-hour simple moving average and the RSI climbed toward 65. There was a clear move above the 50% Fib retracement level of the downward move from the $85.48 swing high to the $80.59 low.
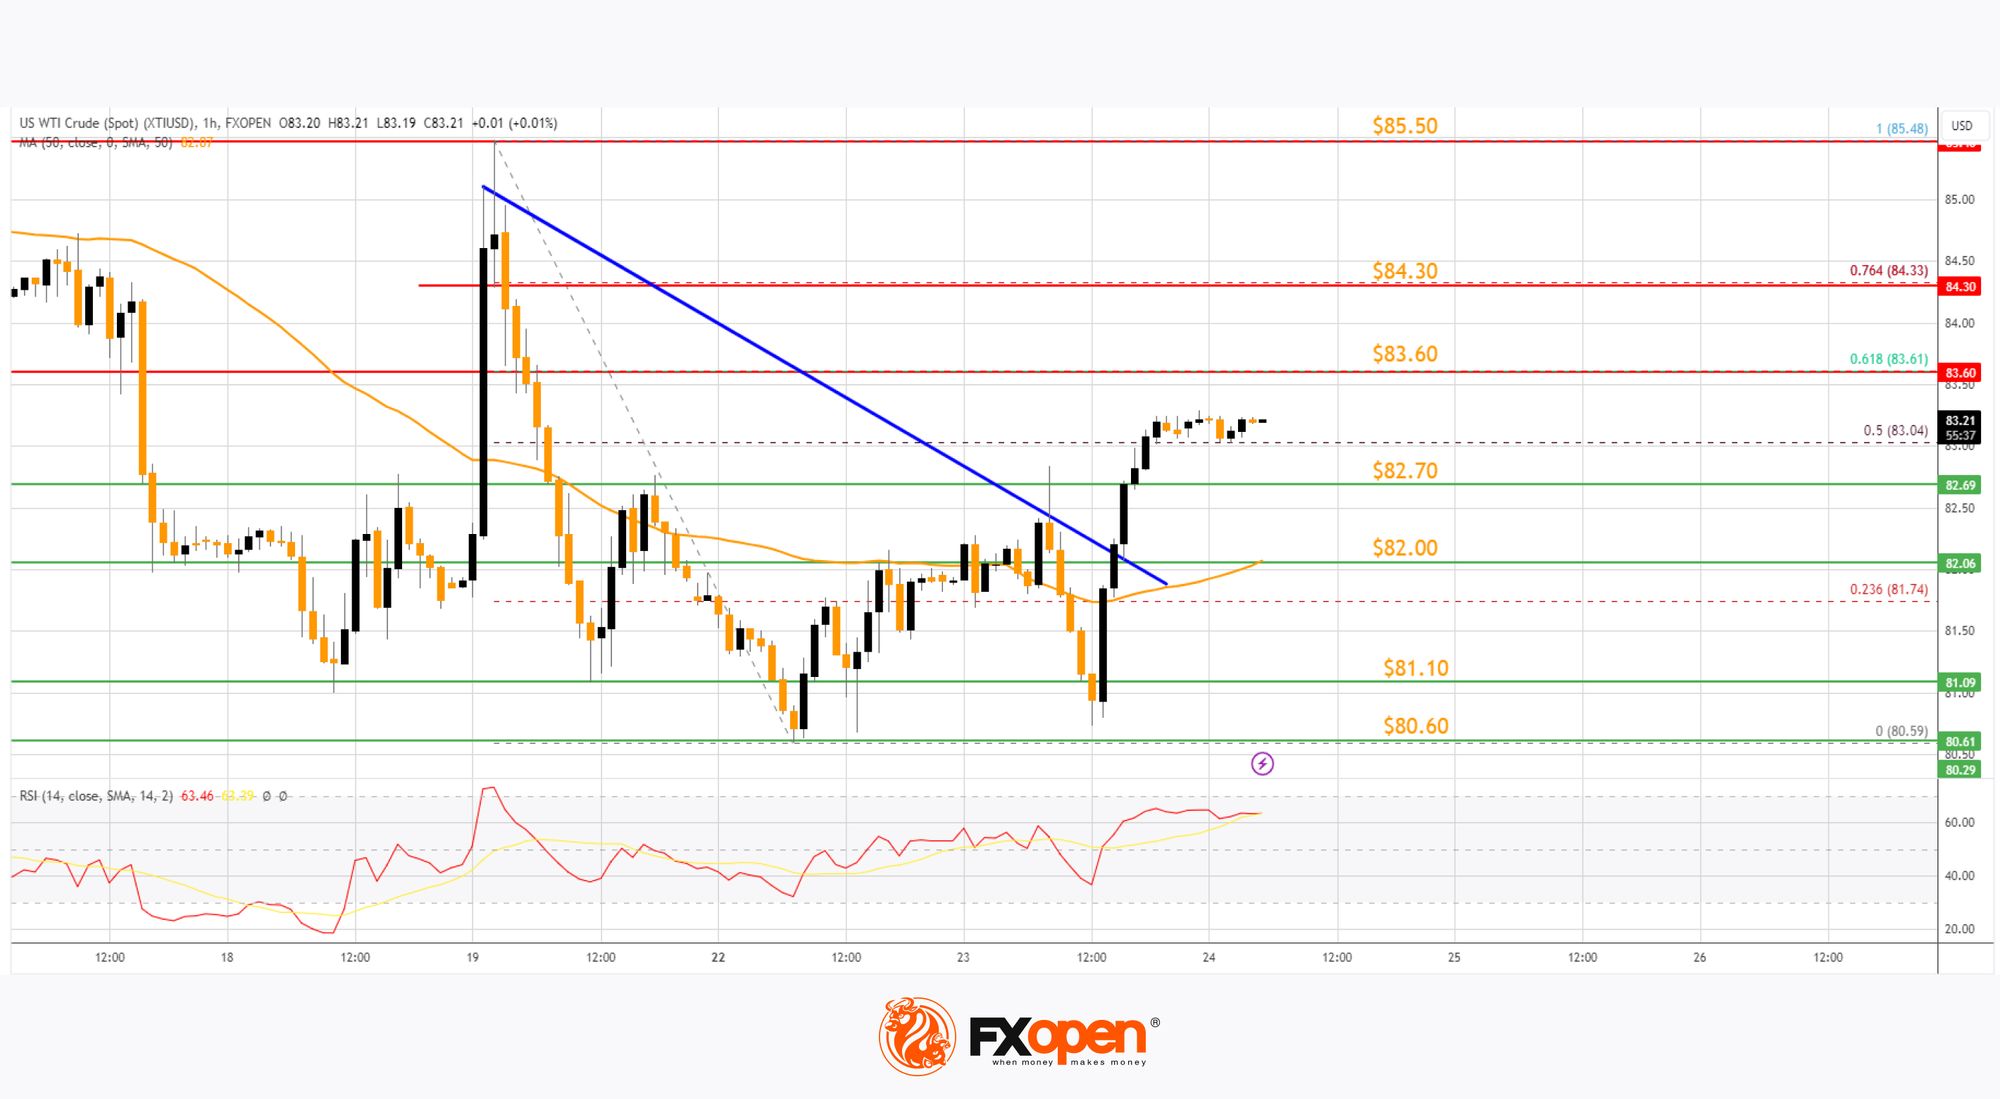
Immediate resistance is near the $83.60 level. It is close to the 61.8% Fib retracement level of the downward move from the $85.48 swing high to the $80.59 low.
If the price climbs further higher, it could face resistance near $84.30. The next major resistance is near the $85.50 level. Any more gains might send the price toward the $87.00 level.
Conversely, the price might correct gains and test the $82.70 support. The next major support on the WTI crude oil chart is near the 50-hour simple moving average at $82.00. If there is a downside break, the price might decline toward $81.10. Any more losses may perhaps open the doors for a move toward the $80.00 support zone.
Trade over 50 forex markets 24 hours a day with FXOpen. Take advantage of low commissions, deep liquidity, and spreads from 0.0 pips. Open your FXOpen account now or learn more about trading forex with FXOpen.
This article represents the opinion of the Companies operating under the FXOpen brand only. It is not to be construed as an offer, solicitation, or recommendation with respect to products and services provided by the Companies operating under the FXOpen brand, nor is it to be considered financial advice.
Latest from Forex Analysis
Latest articles

Weekly Market Wrap With Gary Thomson: FTSE100, US Dollar, USD/JPY, BTC/USD
Get the latest scoop on the week's hottest headlines, all in one convenient video. Join Gary Thomson, the COO of FXOpen UK, as he breaks down the most significant news reports and shares his expert insights.
- London Calling! FTSE 100

The Price of Silver (XAG/USD) is Falling for the Second Consecutive Week
Following a surge in the price of silver close to the important psychological level of $30 per ounce on April 12, bearish momentum is now evident - concluding the week may mark the second consecutive week of decline for XAG/

AAPL Share Price Soars after Record Buyback Announced
Yesterday, after the end of the main trading session, Apple published its report on its activities for the 1st quarter:
→ Earnings per share: actual = $1.53; expected = $1.505;
→ Gross income: actual = $90.75; expected = $90.36.
The better-than-expected report